
Figure 7. Disruption of super-enhancers with panobinostat and THZ1.
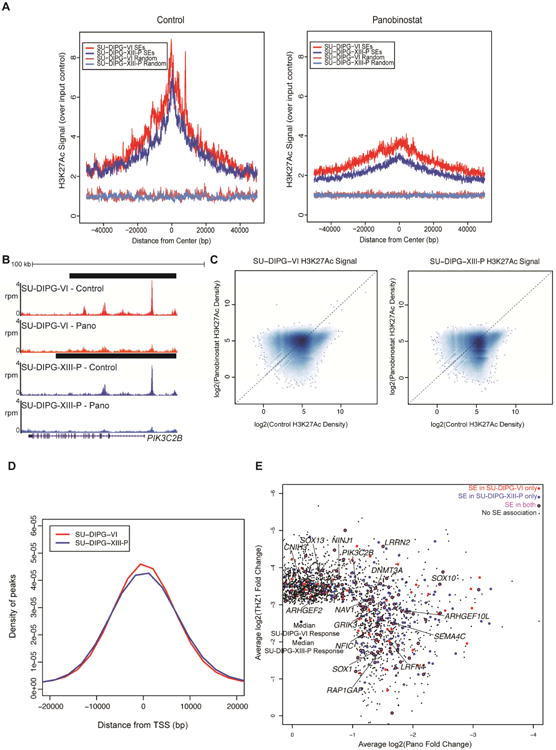
A) SU-DIPG-VI or SU-DIPG-XIII-P cultures treated with panobinostat for 24 hours. H3K27Ac ChIP-seq enrichment over input was plotted for all SEs or an equivalent number of randomly generated regions of median length. B) Representative example of H3K27Ac at an SE before and after panobinostat administration; x-axis represents genomic position and y-axis shows normalized reads per million (rpm). Black bars represent SE calls. C) Log2 transformed H3K27Ac signal density plotted for all peaks identified. Dashed line marks equivalent signal in both DMSO control and panobinostat treated samples. Higher density of points indicated by darker shading. D) Distance was calculated between differential H3K27Ac peaks with the strongest levels of H3K27Ac density in control treated cells and the nearest TSS. The x-axis represents distance from the closest TSS in bp and y-axis represents probability density. E) Top targets in DIPG. Scatter of active transcripts showing greater than two-fold reduction with panobinostat and greater than eight-fold reduction with THZ1 treatment in both cultures. Plotted values are the mean log2(fold change) between SU-DIPG-VI and SU-DIPG-XIII-P. Transcripts shown in magenta are associated with an SE in both cell cultures, shown in red are associated with an SE in SU-DIPG-VI only, and shown in blue are associated with an SE in SU-DIPG-XIII-P only. Black points are transcripts with no SE association. See also Figures S6 and Table S5.