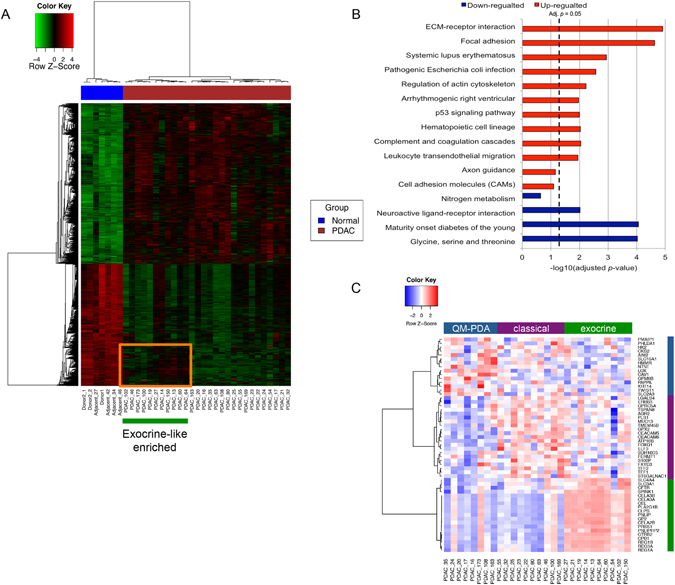
Figure 1.

Differentially expressed protein-coding genes in PDAC. (A) Heatmap of the 1,887 differentially expressed transcript clusters in PDAC. The heatmap represents relative over- (red) and under-expressed (green) genes. The covariates at the top represent tumour (red) and normal (blue) samples. A subgroup of 11 PDAC samples is indicated by the orange box, determined by the exocrine-like gene signature by Collisson et al. with higher expression in a cluster of 255 transcripts than other PDAC samples. (B) KEGG pathway enrichment test for significantly up- and down-regulated genes in PDAC. The BH adjusted p-values were used (x-axis). (C) Heatmap and sample clustering based on the Collisson signature dividing samples into three molecular subtypes.
