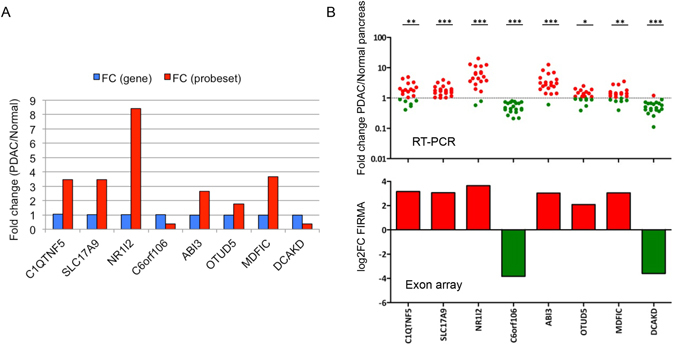
Figure 3.

Real-time PCR validation of exon array data. (A) Selection of 8 splicing probe-sets from non-differentially expressed genes. For these 8 genes/probe-sets, there were no differences in the level of gene expression, but significant differences in the level of probe-set expression. (B) RT-PCR results of the 8 probe-sets. RT-PCR results are represented as scatter dot plots of expression fold change in PDAC compared to normal pancreas, with the significance level shown at the top (* < 0.05, ** < 0.01, *** < 0.001). Corresponding exon array results are reported in histograms of log2 FIRMA fold change (PDAC/normal) values. The two sets of results corresponded well with each other very well.
