
Figure 1.
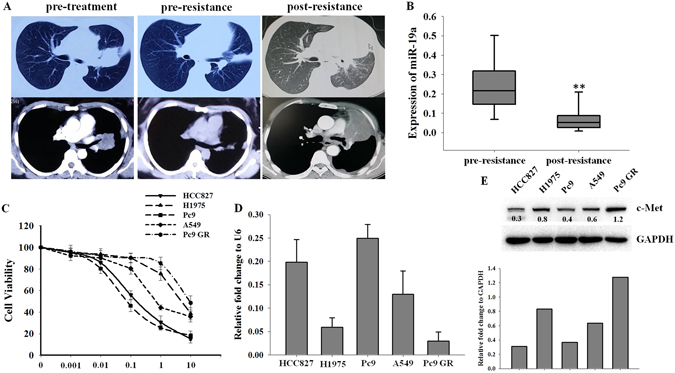
miR-19a expression in NSCLC patient serum samples and cell lines (A). Patients were treated with gefitinib and examined monthly with Computerized Tomographic Scanning (CT). Patients were sensitive to gefitinib at the initial stage and became resistant to gefitinib, which was detected by CT; (B) The expression of miR-19a was detected in patient serum samples. Serum was obtained from fifteen patients prior to oral gefitinib treatment (pre-resistance) and after they had developed gefitinib resistance (post-resistance). Total RNA was extracted from the serum using the miRNeasy mini kit (QIAGEN), and the miR-19a level was measured by real-time PCR (**p < 0.01); (C) NSCLC cell viability was measured. HCC827, H1975, A549, Pc9 and Pc9 GR cells were cultured in 96-well plates and treated with different doses of gefitinib for 72 h before measuring cell viability with CCK8; (D) HCC827, H1975, A549, Pc9 and Pc9 GR cells were cultured and harvested; the miR-19a level was measured by real-time PCR, and its relative fold change was compared to that of U6; HCC827, H1975, A549, Pc9 and Pc9 GR cells were cultured and harvested, the expression levels of miR-19a (D) and c-Met (E, top) were detected, and the expression of c-Met was quantified with GAPDH (E, bottom).