Figure 2.

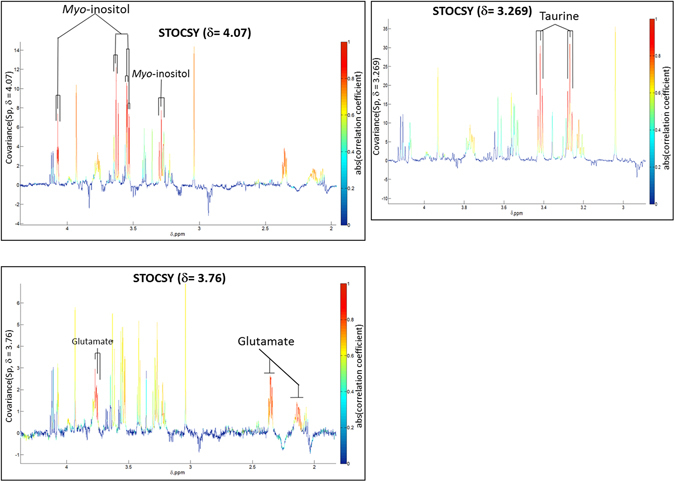
Statistical Total Correlation Spectroscopy (STOCSY). STOCSY showing intra-molecular correlation of peaks related to metabolites (taurine, myo-inositol and glutamate) associated with differentiation of disease from controls.

Statistical Total Correlation Spectroscopy (STOCSY). STOCSY showing intra-molecular correlation of peaks related to metabolites (taurine, myo-inositol and glutamate) associated with differentiation of disease from controls.