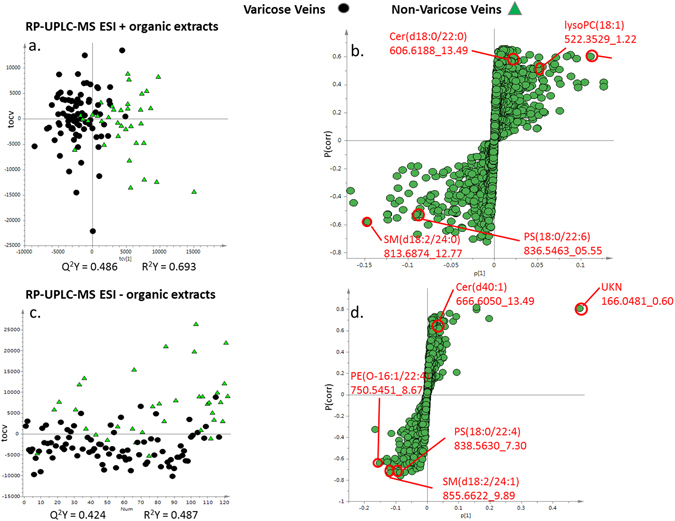
Figure 3.

Multivariate OPLS –DA cross-validated scores and loadings S-plots for UPLC-MS based lipid profiling (ESI +/−) (a) and (c) comparing the varicose veins and non-varicose veins samples and (b) and (d) showing the S loadings plots for the OPLS-DA models. Metabolites at the outer most edges of the S plot are present in higher concentration in one or other group. Robustness of the OPLS-DA model was confirmed by permutations testing. TG Triglyceride, PC Phosphatidylcholine, SM Sphingomyelin, PE Phosphatidylethanolamine, PS phosphatidylserine.
