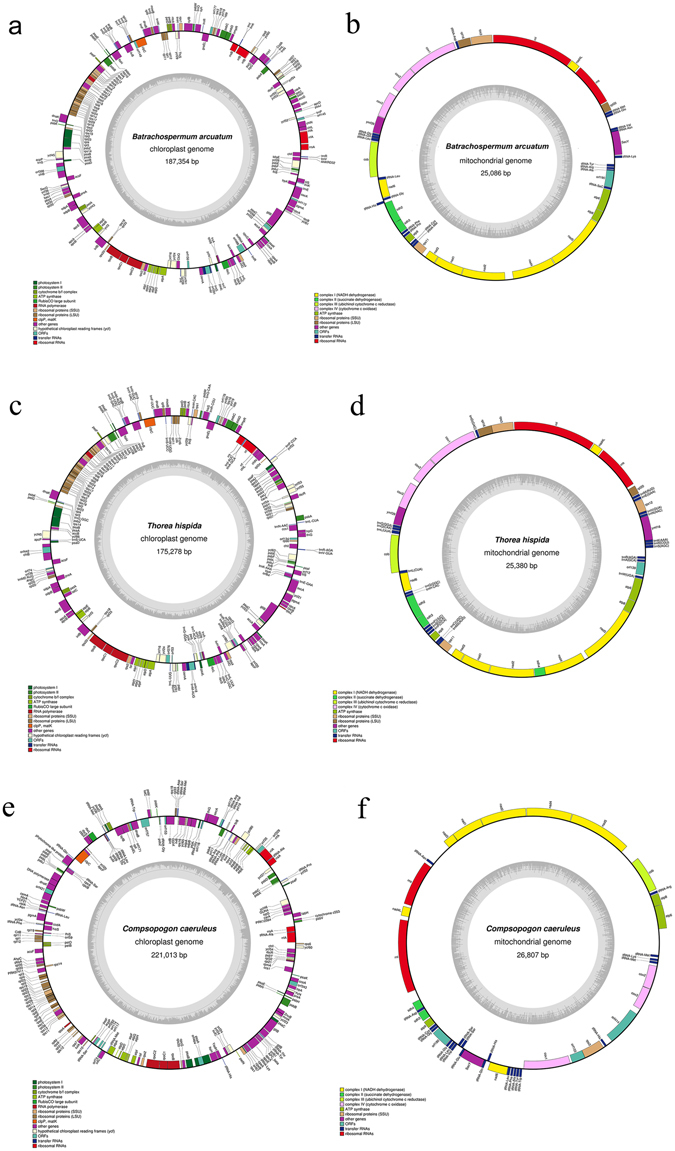
Figure 1.

Organelle genome maps of freshwater Rhodophyta representatives. The genes inside and outside of the circles are transcribed in the clockwise and counterclockwise directions, respectively. Genes belonging to different functional groups are shown in different colors. (a) Chloroplast genome map of Batrachospermum arcuatum. (b) Mitochondrial genome map of Batrachospermum arcuatum. (c) Chloroplast genome map of Thorea hispida. (d) Mitochondrial genome map of Thorea hispida. (e) Chloroplast genome map of Compsopogon caeruleus. (f) Mitochondrial genome map of Compsopogon caeruleus.
