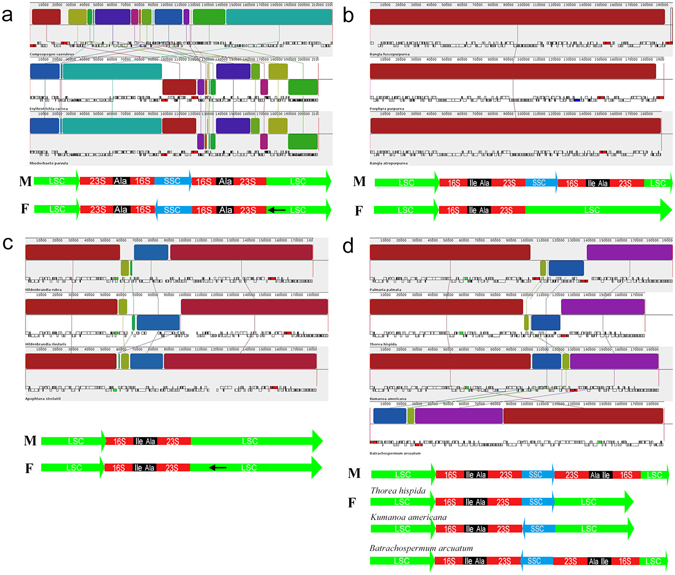
Figure 3.

Synteny alignment of chloroplast genomes between freshwater and marine representatives. (a) Synteny alignment of chloroplast genomes between freshwater and marine Compsopogonophyceae. (b) Synteny alignment of chloroplast genomes between freshwater and marine Bangiophyceae. (c) Synteny alignment of chloroplast genomes between freshwater and marine Hildenbrandiophyceae. (d) Synteny alignment of chloroplast genomes between freshwater and marine Florideophyceae. Note: Lines with “M” and “F” mean types of chloroplast genome architecture for each Rhodophyta lineage. M represent marine species and F represent freshwater species; LSC and SSC represent genomic regions coding for large single copy and small single copy; 23 S and 16 S represent genes coding for 23 S rRNA and 16 S rRNA; Ala and Ile represent genes coding for tRNA-Ala and tRNA-Ile; Black arrows represent partial inverse of the LSC region. Lines connecting each colored bar with crossing “X” pattern represent genomic rearrangements or collinear structure annotated at different starting point.
