
Figure 1.
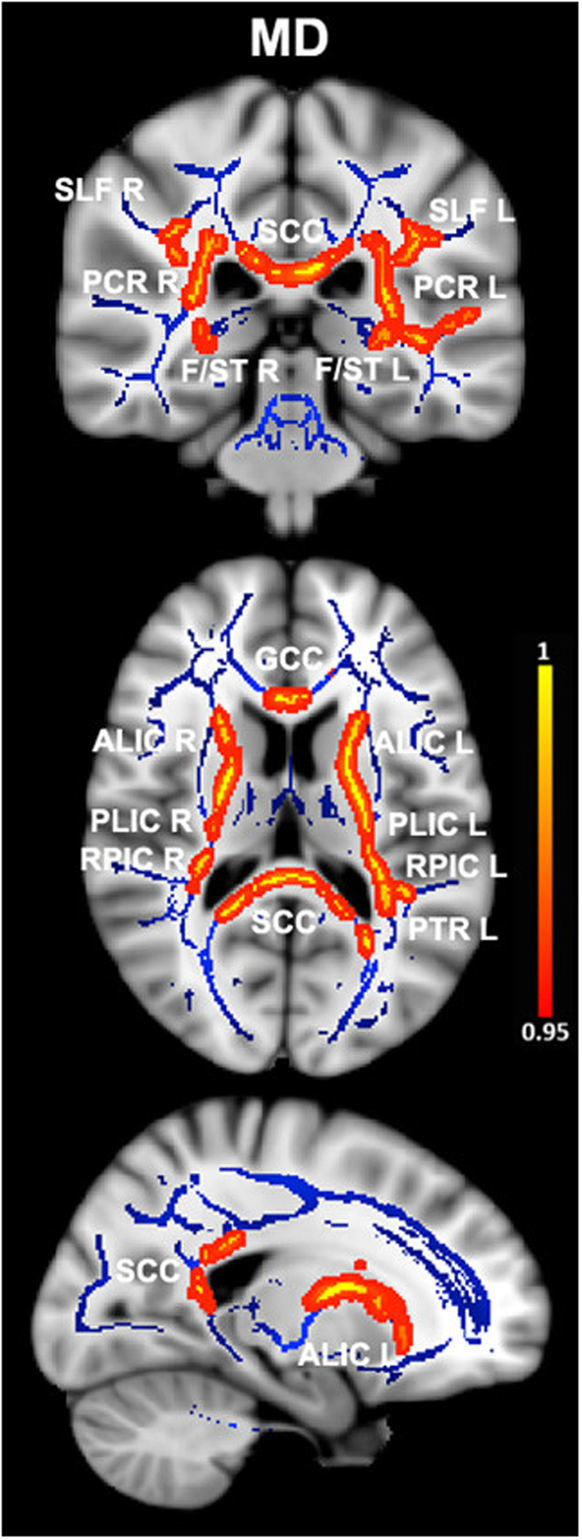
Differences in mean diffusivity values in essential tremor (ET) patients vs. healthy controls. Results from between-group comparison showing clusters with significantly increased mean diffusivity values in ET patients compared with healthy controls (family-wise error–corrected p < 0.05, red-yellow). The group-averaged white matter skeleton (fractional anisotropy threshold > 0.2) is shown in blue. Group differences are mapped onto a standard T1 Montreal Neurological Institute template. Images are in radiological convention (i.e., findings in the left hemisphere are displayed on the right and vice versa). The color bar represents statistical significance (1 minus p-value). SLF L/R, left and right superior longitudinal fasciculus; PCR L/R, left and right posterior corona radiata; SCC, splenium of the corpus callosum; F/ST L/R, left and right fornix (cres)/stria terminalis; GCC, genu of the corpus callosum; ALIC L/R, left and right anterior limb of internal capsule; PLIC L/R, left and right posterior limb of the internal capsule; RPIC L/R, left and right retrolenticular region of internal capsule; PTR L, left posterior thalamic radiation.