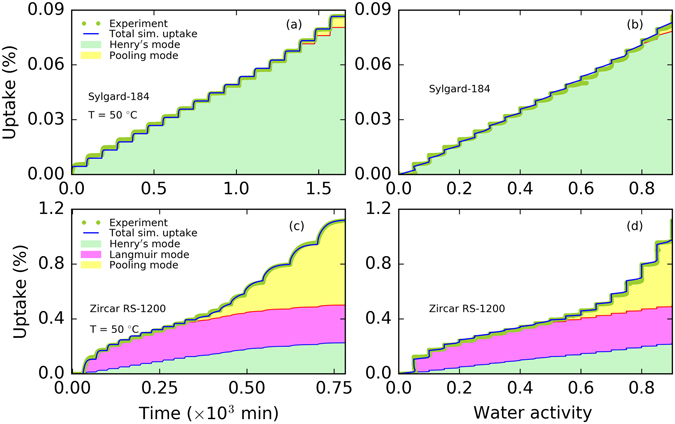
Figure 5.

Experimental and simulated mass uptake and individual contributions from triple-mode sorption at 50 °C. Panel a: mass uptake (in %) vs time (in mins × 103) by Sylgard-184, panel b: mass uptake (in %) vs water activity by Sylgard-184, panel c: mass uptake (in %) vs time (in mins) by Zircar RS-1200, and panel d: mass uptake (in %) vs water activity by Zircar RS-1200. Yellow-green symbols represent the experimental data points, blue lines represent the total simulated uptake from triple-mode sorption. Henry’s absorption mode, Langmuir adsorption mode, and pooling sorption mode contributions to the total mass uptake are shown using light green, magenta, and yellow colors, respectively. Sylgard-184 shows almost all uptake due to Henry’s mode of absorption, whereas Zircar RS-1200 shows the contributions from all three modes.
