
Figure 3.
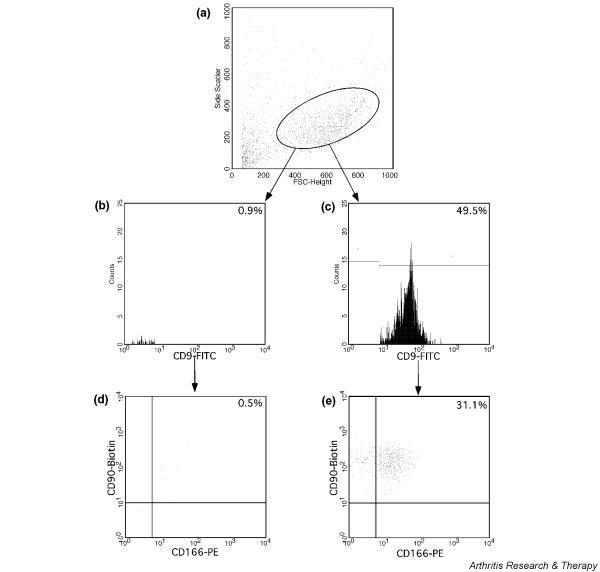
Fluorescence-activated cell sorting analysis of culture expanded chondrocytes. (a) Forward and side scatter (FCS/SSC) of cultured cells. Histograms of CD9-fluorescein isothiocyanate (FITC) (b) negative and (c) positive stained cells. Dot plots show the expression of triple stained cells: CD9-FITC gated (d) negative and (e) positive double-stained CD90-Biotin/CD166-phycoerythrin (PE).