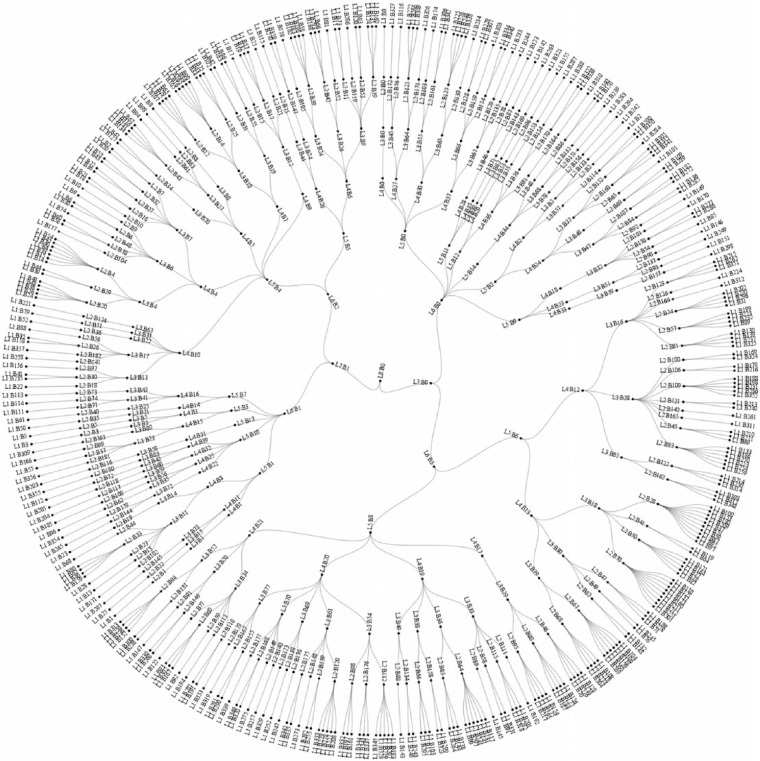
Figure 1.
A visualization of the hierarchical block model, with blocks labeled by level and block ID. The highest level, 8, with its single block of the entire network, labeled L8:B0, at the center. Moving outward, the next level of the block structure is level 7, with its 2 blocks represented by L7:B0 and L7:B1. This pattern continues to the outermost radius of the diagram representing level 1, the most granular level, with its 359 blocks.

