
Figure 3. Newly divided CLL cells are enriched in the CXCR4dim/CD5bright population.
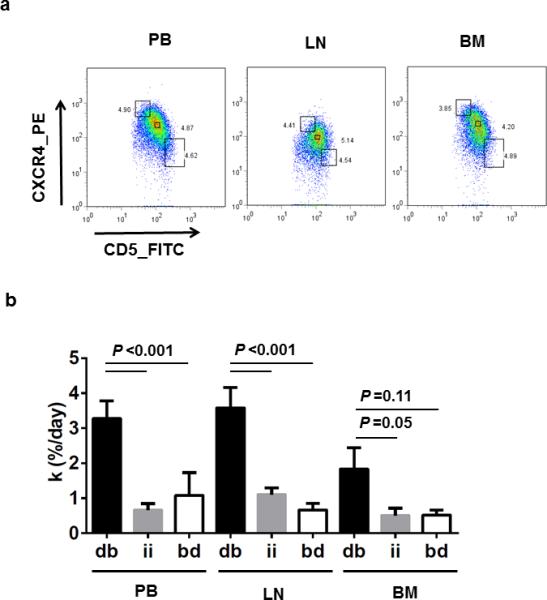
(a) Dot plots of CD19+CD5+ CLL cells collected from PB, LN, and BM on the basis of reciprocal densities of CXCR4 and CD5 surface membrane levels. Flow gates were set to include ~3 to 5% of total cells in each fraction; from top to bottom: CXCR4bright/CD5dim (bd), CXCR4int/CD5int (ii) and CXCR4dim/CD5bright (db). (b) Mean (± standard error of the mean) of the fraction of newly born CLL cells (k) for each of the three flow cytometry sorted fractions (as shown in panel a; db, ii, and bd) for each of the three anatomic compartments (PB (n=11), LN (n=13), and BM (n=4)). Results are detailed for each patient in Table 3. Paired T test was used to compare k between cellular fractions within each anatomic compartment.