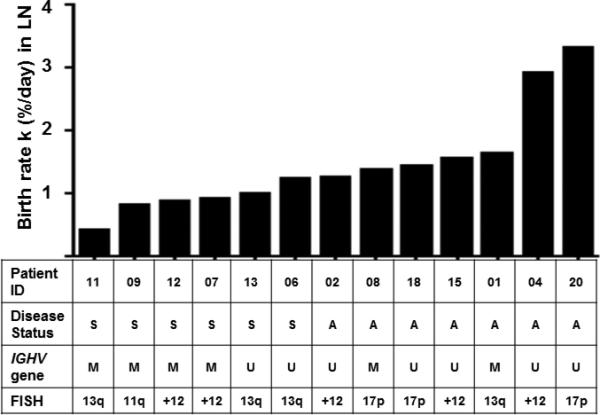
Figure 4. Rate of addition of new cells to the LN population and clinical characteristics of the patients.

Bars depict k in the LN of the individual patients. Patients are arranged from left to right by increasing k values. Disease status (S, stable disease; A, active disease); IGHV mutation status (M, mutated; U, unmutated); and FISH cytogenetics (deletions 13q, 11q, 17p, and trisomy 12 according to the Dohner hierarchical classification).
