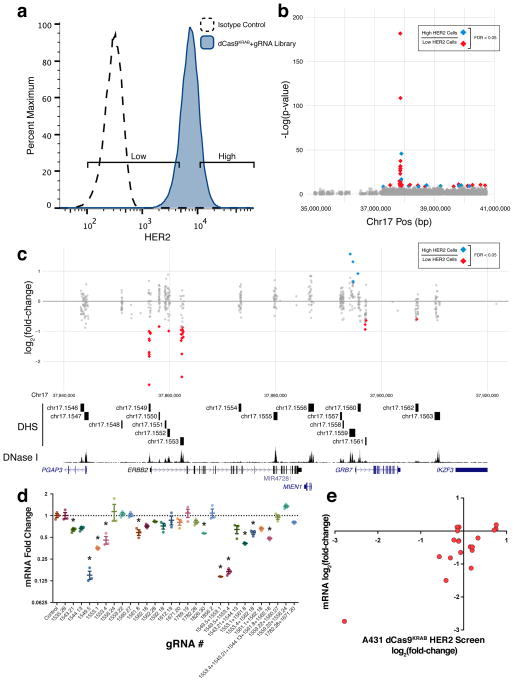
Figure 2.
A dCas9KRAB loss-of-function screen in A431 cells identifies regulatory elements of HER2. (a) Flow cytometry for HER2 expression in A431 cells expressing dCas9KRAB and a gRNA library targeted to all DHSs in 4 Mb surrounding HER2 detected in the HER2-overexpressing SKRB3 breast cancer cell line. (b) Manhattan plot showing regulatory elements affecting HER2 expression. (c) A detailed view of the region around HER2. When comparing high and low HER2-expressing cell populations, gRNAs are enriched in the promoter and an intronic DHS of HER2, as well as surrounding DHSs including the promoter of GRB7, an adapter protein that associates with tyrosine kinases. (d) HER2 mRNA fold-change in response to the most enriched gRNAs from (b) relative to treatment with a control gRNA. * indicates samples are significantly different from control as determined by one-way analysis of variance followed by Dunnett’s Test; adjusted P < 0.05. (n = 3 biological replicates, mean ± SEM). (e) HER2 mRNA log2 fold-change in response to gRNA treatment versus log2 fold-change of the abundance of the corresponding gRNA in the HER2 dCas9KRAB screen (Spearman correlation ρ = 0.5175).

