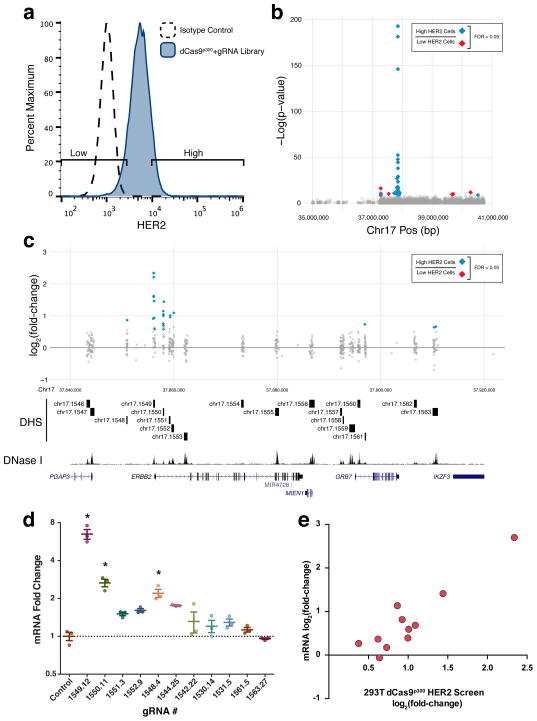
Figure 3.
A dCas9p300 gain-of-function screen in HEK293T cells identifies regulatory elements of HER2. (a) Flow cytometry for HER2 expression in HEK293T cells expressing dCas9p300 and a gRNA library targeted to all the DHSs in a 4 Mb region surrounding HER2 found in the SKBR3 HER2-overexpressing breast cancer cell line. (b) Manhattan plot showing the results of a screen for regulatory elements affecting HER2 expression. (c) A detailed view of the region around HER2. When comparing high and low HER2-expressing cell populations, gRNAs are enriched in the promoter and three intronic DHSs of HER2 as well as several nearby DHSs. (d) HER2 mRNA fold-change in response to the most enriched gRNAs from (b) relative to treatment with a control gRNA. * indicates samples are significantly different from control as determined by one-way analysis of variance followed by Dunnett’s Test; adjusted P < 0.05 (n = 3 biological replicates, mean ± SEM). (e) HER2 mRNA log2 fold-change in response to gRNA treatment versus log2 fold-change of the abundance of the corresponding gRNA in the HER2 HEK293T dCas9p300 screen (Spearman correlation ρ =0.9429).

