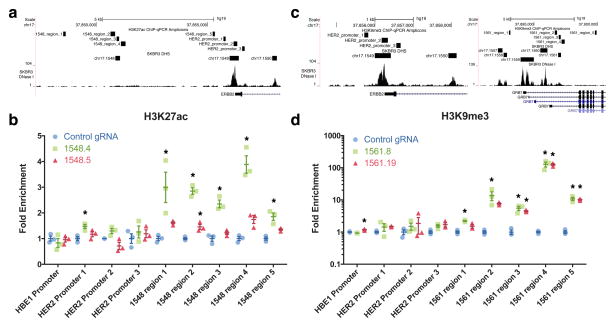
Figure 4.
dCas9p300 and dCas9KRAB remodel epigenetic marks near novel regulatory elements identified from screens. (a) Genomic tracks displaying the qPCR amplicon regions for the H3K27ac ChIP-qPCR assay, DNase-seq signal, and DHS sites for SKBR3 cells near HER2. (b) dCas9p300 targeted to a DHS with a gRNA enriched in the screen (1548.4) in HEK293T cells leads to H3K27ac enrichment near the DHS, in contrast to gRNA 1548.5 targeting the same DHS but was not enriched in the screen. (c) Genomic tracks displaying the qPCR amplicon regions for the H3K9me3 ChIP-qPCR assay, DNase-seq signal, and DHS sites for SKBR3 cells near HER2 and GRB7. (d) dCas9KRAB targeted to a DHS with a gRNA enriched in the screen (1561.8) in A431 cells deposits H3K9me3 near the DHS. A gRNA that was not significantly enriched in the screen (1561.19) also deposits similar amounts of H3K9me3 near the DHS. * indicates samples are significantly different from control as determined by one-way analysis of variance followed by Dunnett’s Test; adjusted P < 0.05 (n = 3 biological replicates, mean ± SEM). All fold enrichments are relative to transduction of a control gRNA and normalized to a region of the ACTB locus.

