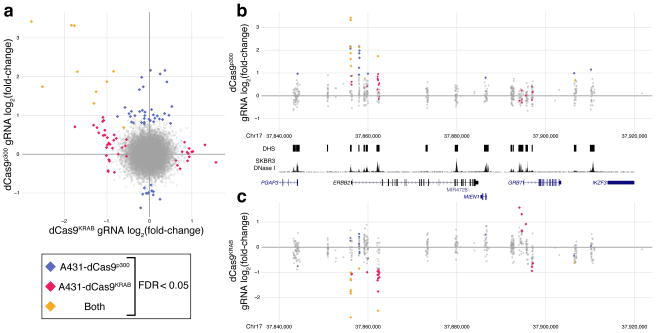
Figure 6.
Comparisons between HER2 activation and repression screens. (a) Log2 fold-change of the gRNA abundance in the dCas9KRAB screen versus the dCas9p300 screen in A431 cells. (b and c) A detailed view of the region around HER2 for the (b) dCas9p300 or (c) dCas9KRAB screens in A431 cells. Several DHSs contain enriched gRNAs in both screens, including the promoter and an HER2-intronic DHSs. However, DHSs in the GRB7 promoter region are only enriched in the dCas9KRAB screen.

