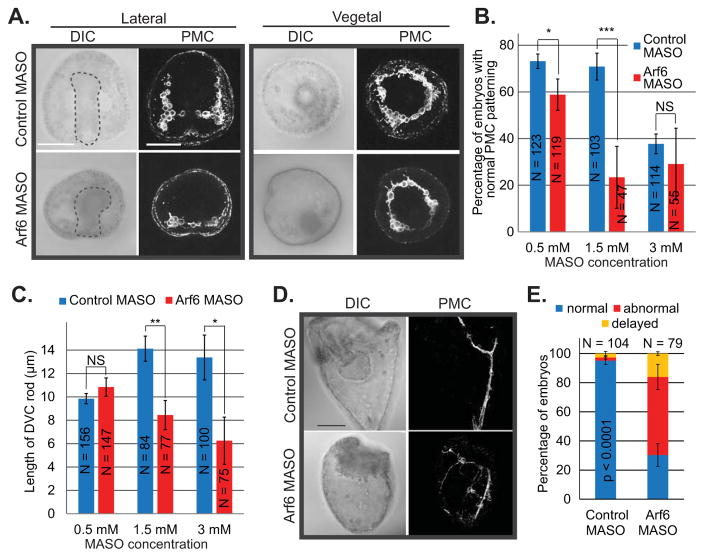
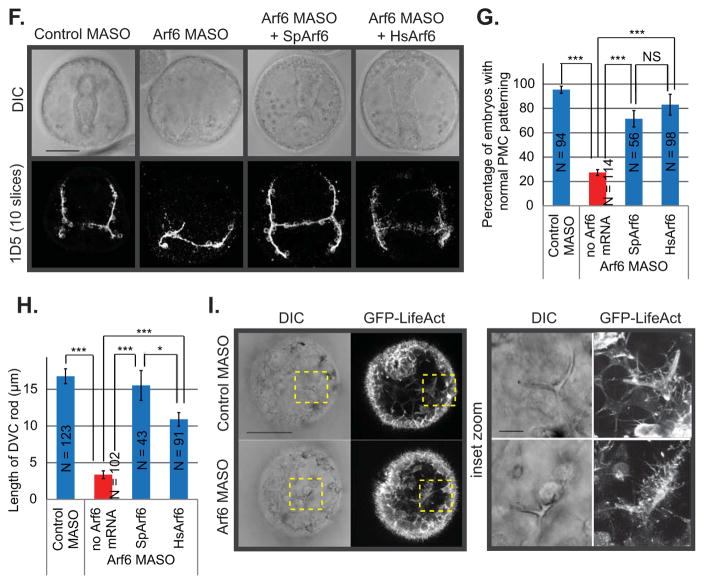
Fig. 2. Arf6 knockdown resulted in skeletogenesis and PMC positioning defects.
(A) Control or Arf6 MASO was microinjected into the newly fertilized eggs. Gastrulae were immunolabeled using 1D5 antibody against PMCs. The gut is outlined in the DIC image. The maximum intensity projection of 4 digital slices is shown for the PMC immunostaining. Scale bar is 50 μm. (B) The percentage of embryos with normal PMC positioning in Arf6 MASO injected embryos is significantly lower than in control MASO injected embryos in a dose-dependent manner (Cochran-Mantel-Haenszel test). (C) The lengths of DVC rod were significantly decreased in the Arf6 KD embryos compared to the control in a dose-dependent manner (Student’s T-test). (D) Skeletogenic defects caused by Arf6 KD (1–1.5 mM MASO) persisted to the larval stage (72 hpf). The maximum intensity projection of 10 digital slices is shown. Scale bar is 50 μm. (E) The percentage of larvae at 72 hpf with normal PMC positioning was significantly reduced upon Arf6 KD (1 mM MASO) (Cochran-Mantel-Haenszel test). The delayed category is defined as embryos that were developmentally delayed with normal PMC positioning. (F) 1 mM Arf6 MASO was microinjected into the newly fertilized eggs alone or co-injected with either sea urchin Arf6 (SpArf6) or human Arf6 (HsArf6) mRNA (0.4 μg/μL), which significantly rescued the Arf6 KD phenotype. Gastrulae were immunolabeled using 1D5 antibody against PMCs. Scale bar is 50 μm. (G) PMC positioning defects and (H) shortened DVC rods induced by Arf6 KD (1 mM MASO) were rescued with either co-injection with SpArf6 or HsArf6 mRNA. (I) The GFP-LifeAct was co-injected with either Arf6 MASO or control MASO (1 mM MASO). Dashed areas indicate the enlarged area of the embryo. Arf6 KD embryos had less abundant and shorter filopodia extending from the cells surrounding the skeleton compared to the control. The maximum intensity projection of 5 digital slices is shown, scale bar is 50 μm for the whole embryos and 10 μm for the inset. *** p < 0.0001; * 0.01 < p < 0.05. NS indicates not significant (p > 0.05).


