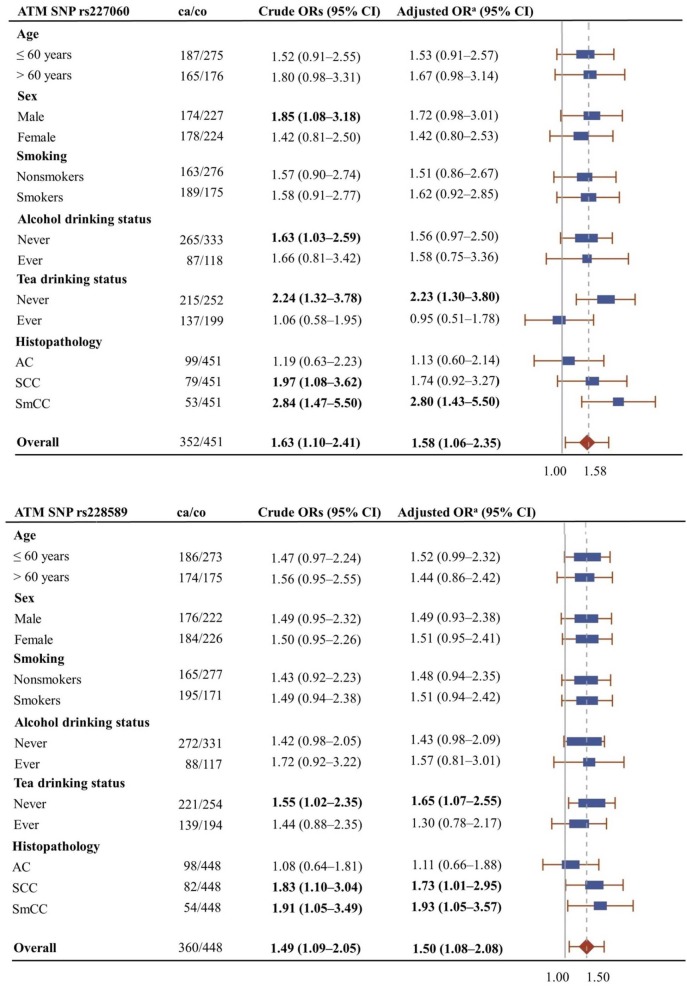
Figure 1.
Forest plots showing the association of ATMrs227060 and ATMrs228589 with lung cancer among different subgroups. Plot shows adjusted odds ratios. aAdjusted for age, sex, and smoking status (0 = never smokers, 1 = ever smokers). ca/co, number of cases/controls; AC, adenocarcinoma; SCC, squamous cell carcinoma; SmCC, small cell carcinoma. The solid line in the plot represents null value and the broken line represents overall odds ratio (OR). Size of the square represents the inverse of the variance of the log OR. ORs in bold represent statistically significant associations.

