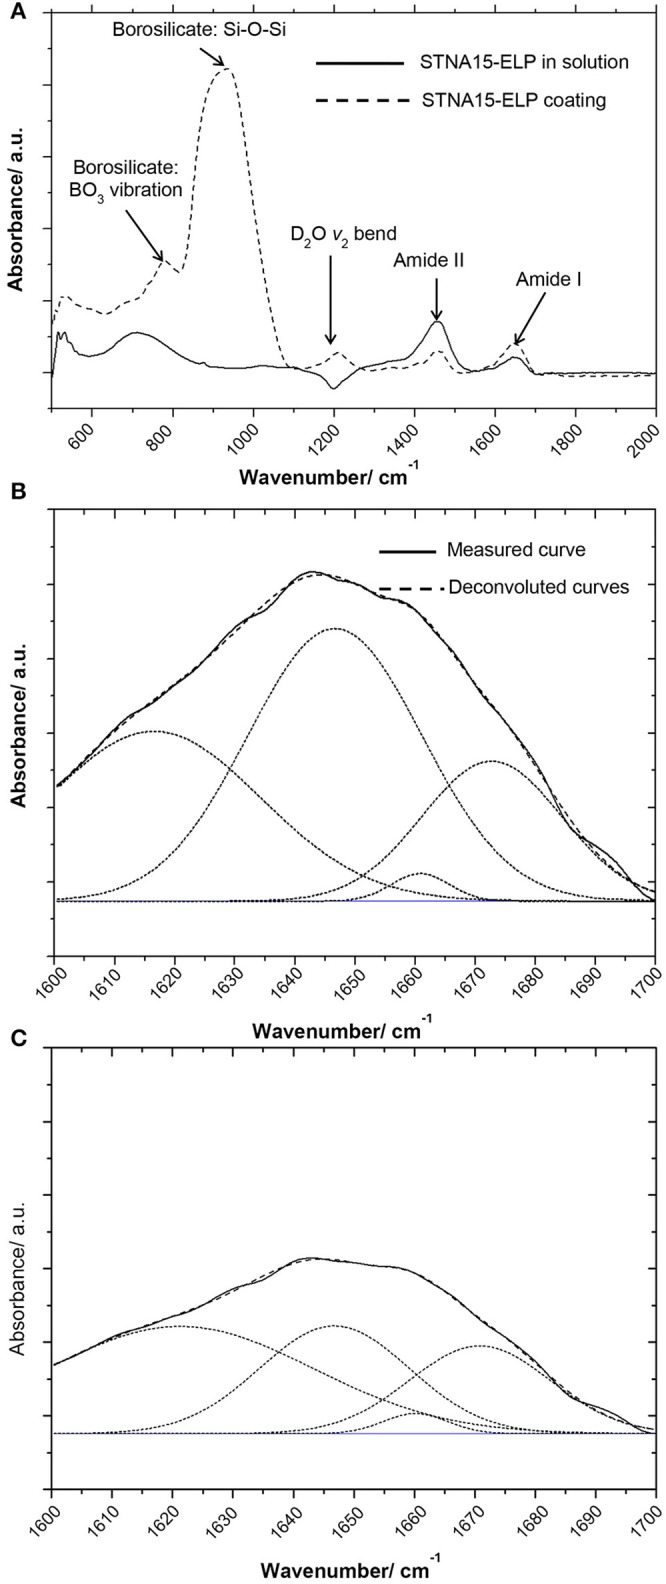
Figure 2.

FTIR results of (A) coated ELP (dotted line) vs. STNA15-ELP in solution (solid line) showing the difference in the absorbance, especially noticeable difference in the intensity of amide I and II peaks. The Gaussian fit deconvoluted amide I band of (B) STNA15-ELP coated on glass and (C) protein in solution. The dashed line represents the data and the smooth line is the Gaussian fit.
