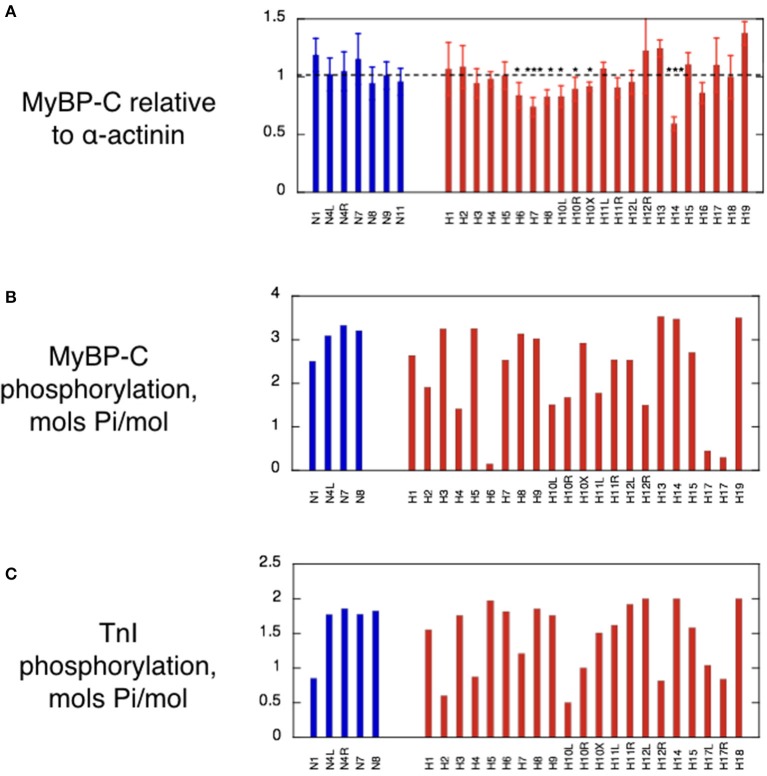
Figure 3.
MyBP-C content, MyBP-C phosphorylation and Troponin I phosphorylation in cat heart muscle samples. (A) Histogram showing the MyBP-C content of the cat samples based on analysis of multiple SDS-PAGE gels similar to those in Figure 2. The normalized ratio of MyBP-C band to α-actinin is plotted as the mean and standard deviation of at least 6 replicate lanes for each sample. Non-HCM and HCM cat samples were compared by one-way ANOVA and 5 samples showed significant haploinsuffficiency. *p ≤ 0.05, **p ≤ 0.01, ***p ≤ 0.001. (B) Histogram of the phosphorylation levels of MyBP-C measured by phosphate affinity SDS-PAGE using the technique of Copeland et al. (2010). See supplement for details of method. (C) Histogram of troponin I phosphorylation levels in cat myofibrils measured by phosphate affinity SDS-PAGE using the technique of Messer et al. (2009). See supplement for details of method. Blue bars, non-HCM cat samples; red bars, HCM cat samples.

