
Figure 7.
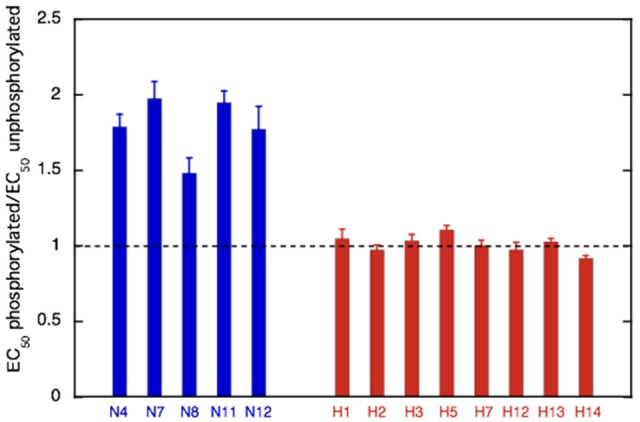
Effect of phosphorylation on Ca2+-sensitivity in non-HCM and HCM cat. The mean ratio of EC50 phosphorylated:EC50 unphosphorylated ± sem is plotted for at least three replicate experiments for non-HCM cat troponin (blue) and HCM cat troponin (red). A ratio of 1 (dotted line) indicates uncoupling. Full data is shown in Supplementary Table S3.