
FIGURE 2.
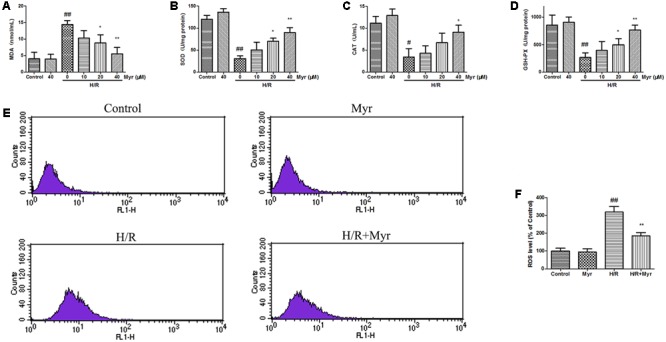
Effects of myricitrin on oxidative damage in H9c2 cells. Cells incubated with different concentrations of myricitrin (10, 20, and 40 μM) for 12 h, were further exposed to 6 h of hypoxia followed by 12 h reoxygenation. (A) MDA. (B) SOD. (C) CAT. (D) GSH-Px. (E) Flow cytometry analysis of the intracellular ROS. (F) Statistical analysis of the flow cytometry data. H/R, hypoxia/reoxygenation; Myr, myricitrin. The data are presented as the means ± SD (n = 8 per group). #p < 0.05 versus control, ##p < 0.01 versus control; ∗p < 0.05 versus H/R-treated cells, ∗∗p < 0.01 versus H/R-treated cells.