FIGURE 2.
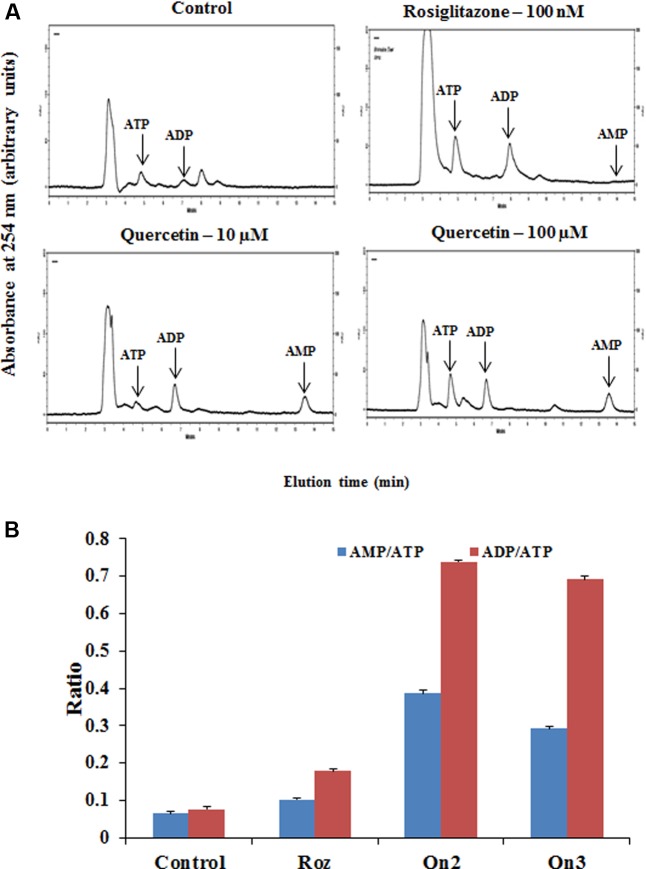
Analysis of adenine nucleotide levels in L6 myotubes. (A) Effect of quercetin on cellular nucleotide levels. The effect of different treatments (Rozi: rosiglitazone (100 nM); Qn (2, 3): quercetin (10 and 100 μM) on cellular nucleotides was determined by HPLC. In each case, a representative trace is shown. The position at which ATP, ADP and AMP standards eluted are approximately 5.4, 7.02, and 13.5 min, respectively, as indicated on each trace by arrows. (B) Adenine nucleotides ratio in L6 myotubes. The ratio of AMP to ATP and ADP to ATP are depicted in the above bar diagram. Adenine nucleotide concentrations and hence ratio changes on citrus flavonoids pretreatment. Rozi: rosiglitazone (100 nM); Qn (2, 3): quercetin (10 and 100 μM). Data are the mean results of three independent experiments ± SD.

