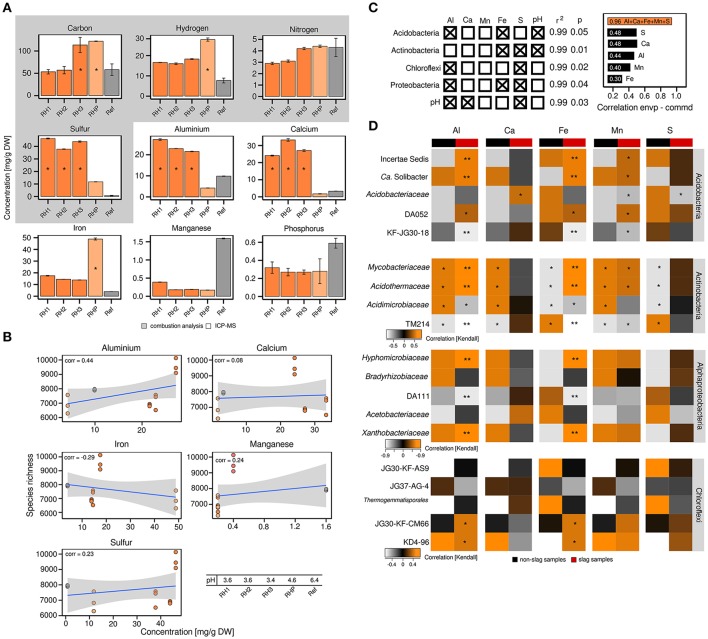
Figure 2.
Correlation analyses between the abundance of particular bacterial taxa and elements. Detection and quantitation of the examined elements involved combustion analysis and inductively coupled plasma mass spectrometry, *significant enrichment (p ≤ 0.05) based on one-way ANOVA, DW = dry weight (A). Correlation analysis between bacterial species richness and particular elements based on Pearson correlation coefficients (corr = correlation) (B). Multiple regression analysis based on log-transformed elemental data (left) and correlations between either individual environmental parameters or the complete set of all five environmental parameters and bacterial community structure as determined by relating the environmental parameters to determined Jensen-Shannon divergences (right; envp = environmental parameter, commd = community dissimilarity) (C). Kendall's tau coefficients were calculated to link the occurrence of specific taxa within phyla of interest to selected environmental parameters. Determined p-values were corrected for multiple comparisons (Benjamini and Hochberg, 1995). Asteriks indicate *p ≤ 0.05 and **p ≤ 0.01 (D).

