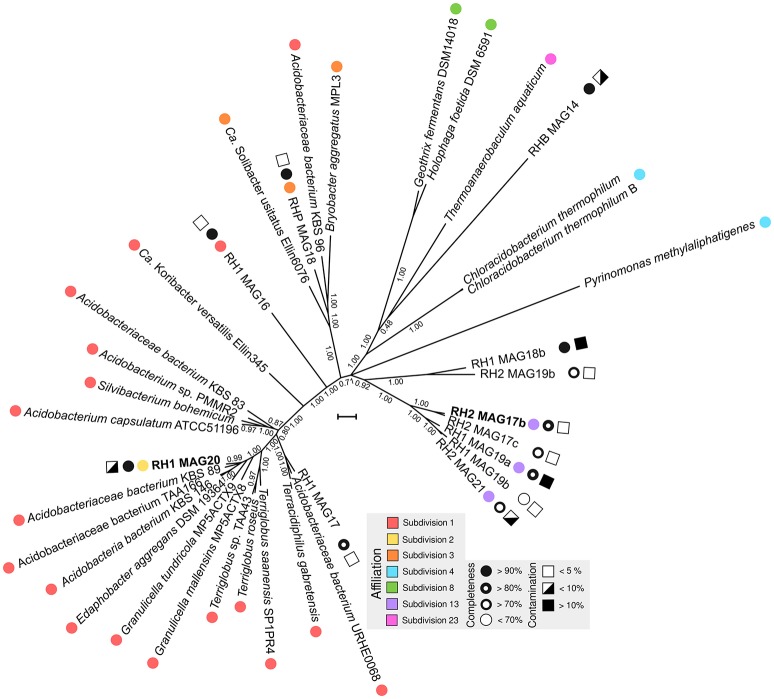
Figure 3.
Phylogenetic tree of MAGs. Available Acidobacteria genomes of known phylogenetic affiliation were retrieved from the NCBI genome repository. Phylogenetic treeing was based on a concatenated alignment of 31 single-copy marker genes using AMPHORA (v. 2) (Wu and Scott, 2012). Using FASTTREE (v. 2.1.3) (Price et al., 2010), a maximum-likelihood tree was calculated applying the WAG model (Whelan and Goldman, 2001). Nearest neighbor interchange and the CAT approximation were used to optimize tree topology and to consider evolutionary rate heterogeneity (Stamatakis, 2014). Colored circles indicate the taxonomic affiliation based on available 16S rRNA gene sequences. Black-white spheres and squares show the degree of completeness and contamination, which was derived from the presence/absence of single-copy marker genes and their actual copy number in the MAGs (Parks et al., 2015). MAGs analyzed in more detail are highlighted in bold. The scale bar indicates 0.1 substitutions per amino acid position.

