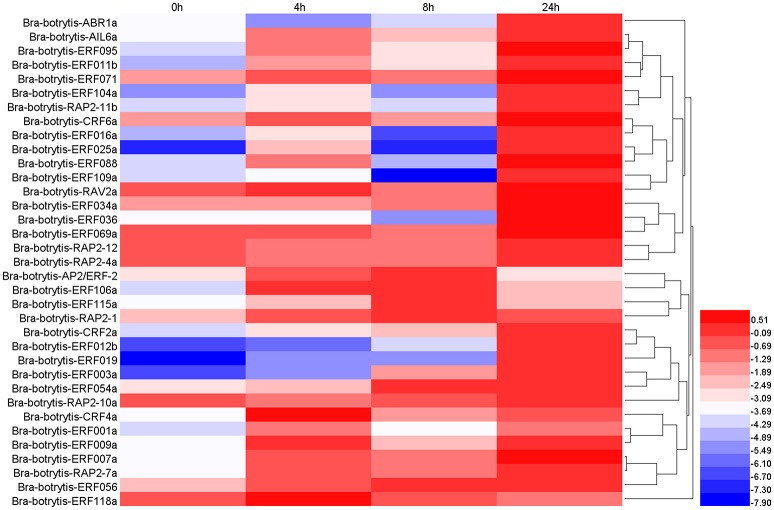
Figure 6.
Expression profiles of 35 putative cauliflower AP2/ERF transcription factors at 0 (control), 4, 8, and 24 h after salt treatment. The heat map is constructed based on the Log2 (relative expression level of each transcription factor) detected by qRT-PCR. The color scale represents the Log2 (relative expression level of each transcription factor) with blue denoting low expression and red denoting high expression.

