
FIGURE 2.
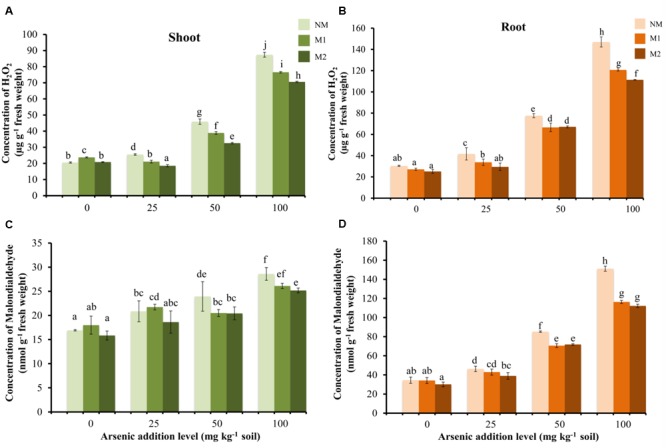
Effect of As addition levels and AMF treatments on concentrations of H2O2 in (A) shoot and (B) root and MDA in (C) shoot and (D) root of T. aestivum L. var. HD-2967 plants. Data is represented as mean ± SD (n = 5). Bars showing different letters indicate significant differences among treatments according to the Duncan’s multiple comparison test (p < 0.05); where NM, non-mycorrhizal; M1, R. intraradices; M2, G. etunicatum.