
FIGURE 8.
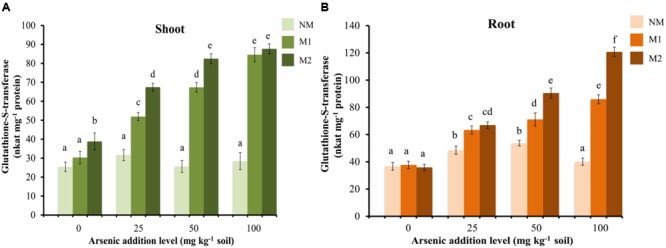
Effect of As addition levels and AMF treatments on the activity of GST in (A) shoot and (B) root of T. aestivum L. var. HD-2967 plants. Data is represented as mean ± SD (n = 5). Bars showing different letters indicate significant differences among treatments according to the Duncan’s multiple comparison test (p < 0.05); where NM, non-mycorrhizal; M1, R. intraradices; M2, G. etunicatum.