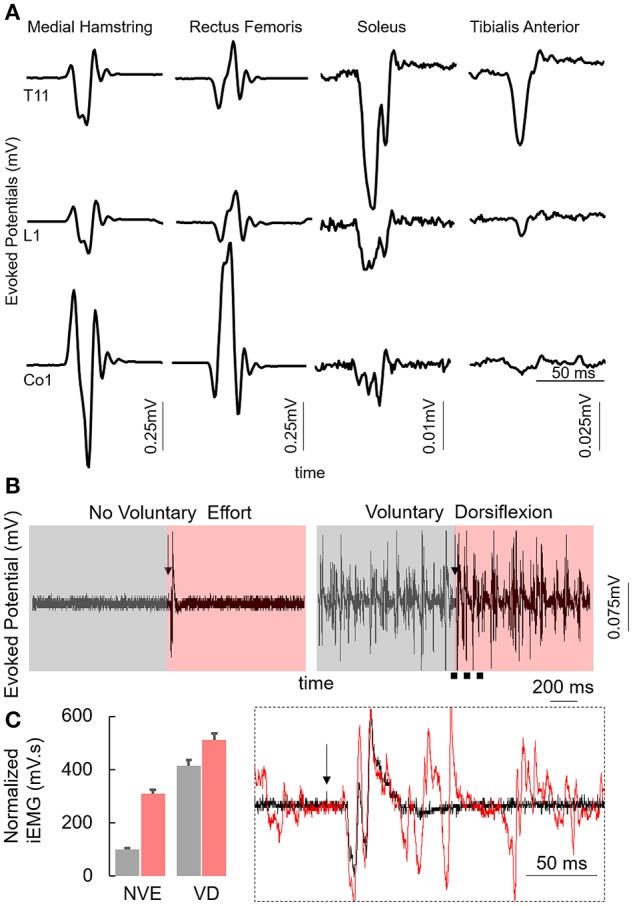
Figure 1.

(A) Average motor evoked potentials (n = 5) at 200 mA while stimulating the T11, L1, and Co1 vertebral levels with the subject in supine position from the multiple lower limb muscles. (B) Average motor evoked potentials (n = 3) from the MG muscles with the subject in supine position at T11 (110 mA) vertebral level during control conditions (No Voluntary Effort, NVE) or with the subjects voluntarily attempting to maximally dorsiflex (Voluntary Dorsiflexion, VD). Box inset: zoomed in view during NVE and voluntary dorsiflexion 1 s before the stim pulse (gray) and 1 s after the stim pulse (red). Note the black arrow marks the stimulation pulse. (C) Normalized mean+SD integrated EMG for the duration highlighted in (B). Inset represents the zoomed in view of the region marked by black dotted line. Each of these data were collected at PreStim time point.
