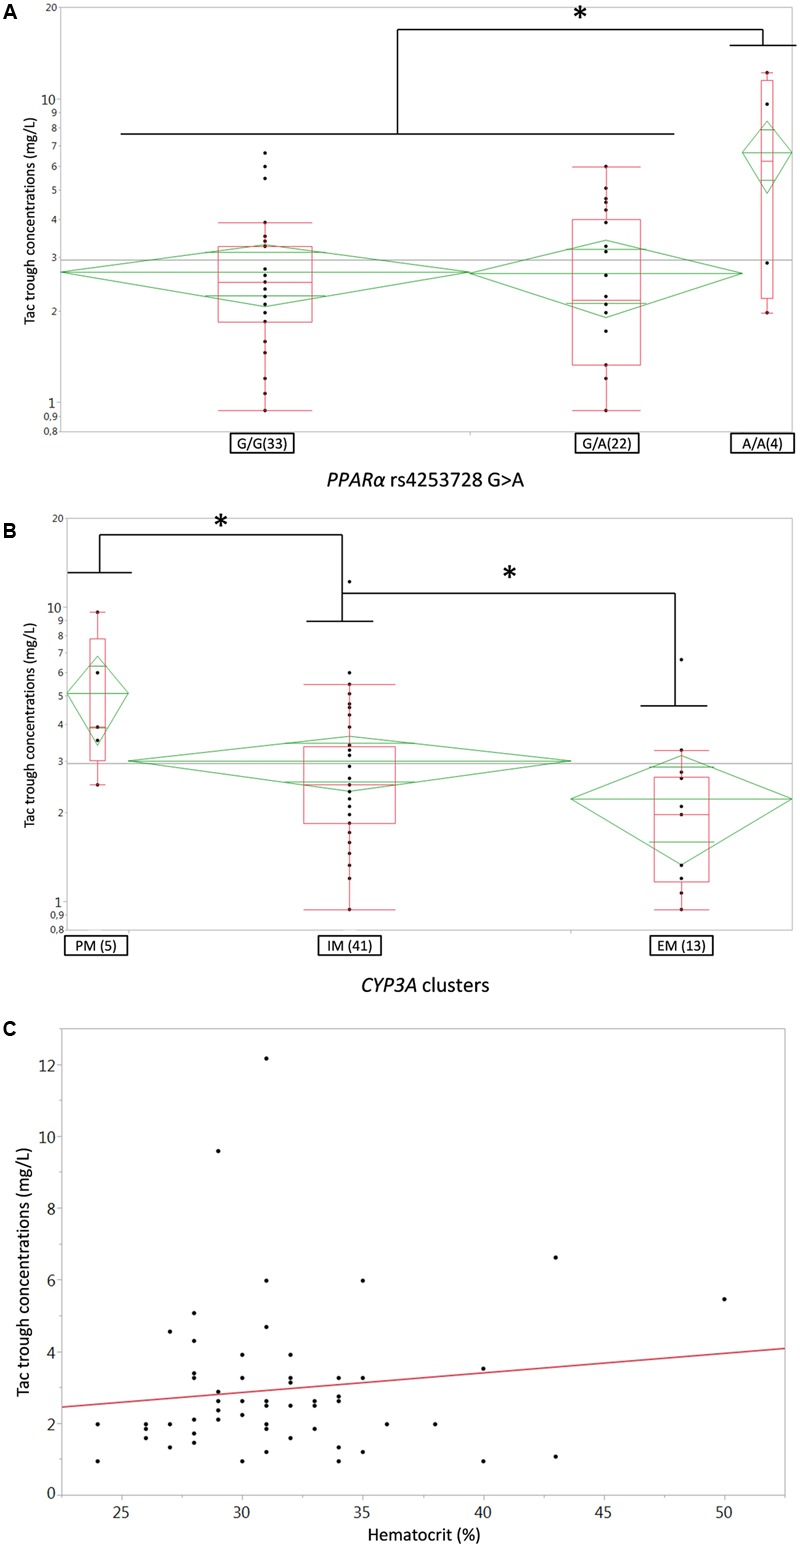
FIGURE 1.

(A,B) Box-and-whisker plots of Tac C0 (ng/ml) according to (A) PPARa rs4253728G > A SNP or (B) CYP3A genotype clusters. The boxes depict the interquartile ranges (IQR) with the bottom and the top of the boxes representing the first (Q1) and third quartiles (Q3), respectively, and the band inside the boxes indicating the medians (Q2), the whiskers link the box with Q1+1.5xIQR and Q3+1.5xIQR and the diamonds represents the means (diagonal) with their respectiveIC95%; (C) linear regression plot of Tac C0 (ng/ml) on the Y-axis versus Hematocrit (%) on the X-axis; each dot represents a couple of data for one individual patient, the solid red line represents the fitted linear regression line. PM, poor metabolizer, IM, intermediate metabolizers, EM, extensive metabolizers. ∗p < 0.05.
