FIGURE 4.

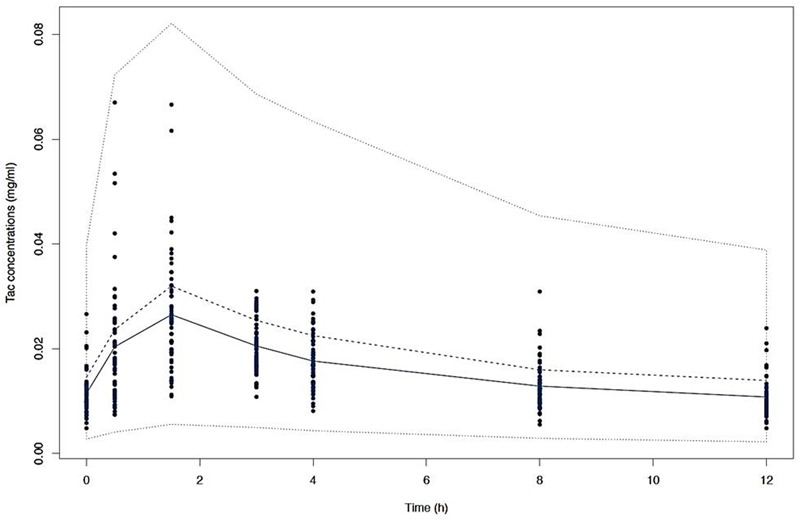
Visual predictive check (VPC) of simulated concentrations (dashed lines) represented by the 10th, 50th, and 90th percentiles versus time with the mean observed Tac concentrations (solid line) and the individual values (dots).

Visual predictive check (VPC) of simulated concentrations (dashed lines) represented by the 10th, 50th, and 90th percentiles versus time with the mean observed Tac concentrations (solid line) and the individual values (dots).