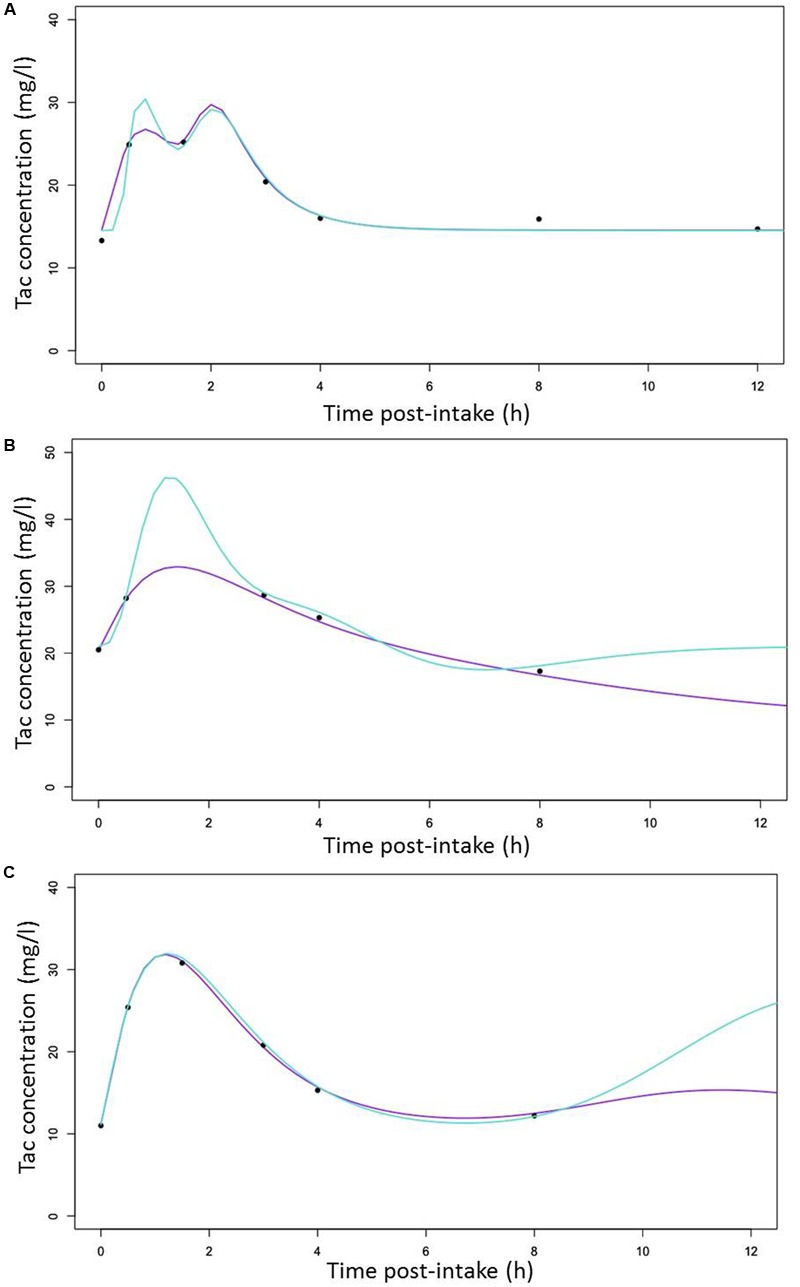
FIGURE 5.

Random selection of Individual predicted Tac concentrations versus time curves (lines) with observed Tac concentrations represented by cross symbols (x) for (A) a CYP3A poor metabolizers (B) a CYP3A Intermediate metabolizers (C) a CYP3A extensive metabolizers with predicted line generated with the structural (turquoise) and the covariate (purple) models, respectively.
