
FIGURE 6.
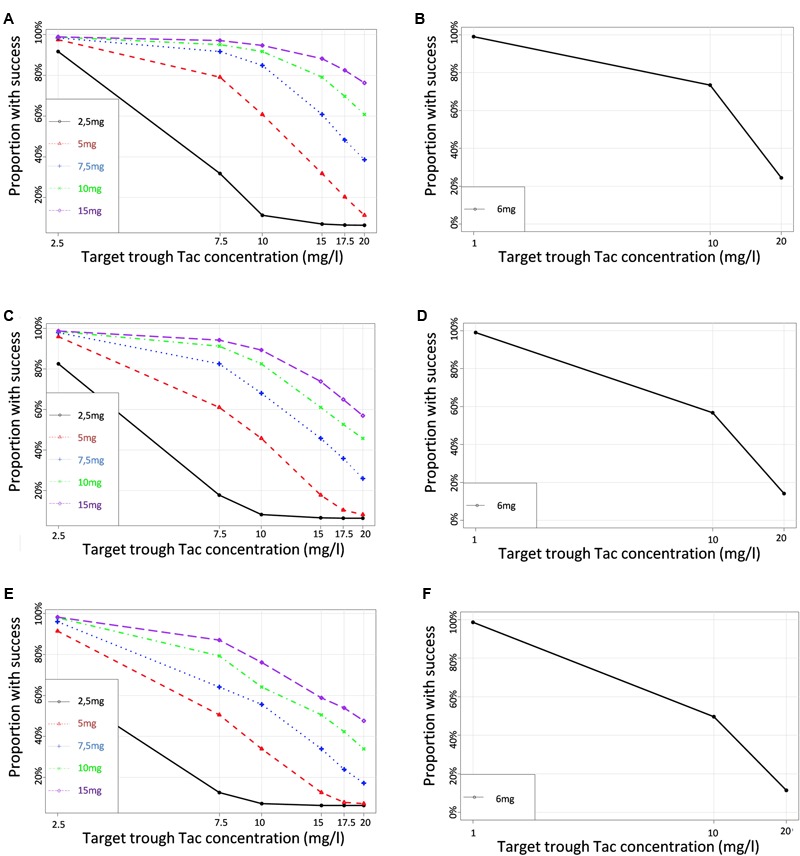
Proportions of simulated patients achieving different Tac C0 targets with various dosage regimens in (A,B) CYP3A poor metabolizers (C,D) CYP3A Intermediate metabolizers (E,F) CYP3A extensive metabolizers. Left panels correspond to the simulation performed for a set of virtual dosages, and right panels simulations performed for the actual initial dosage that was really given to the patients.