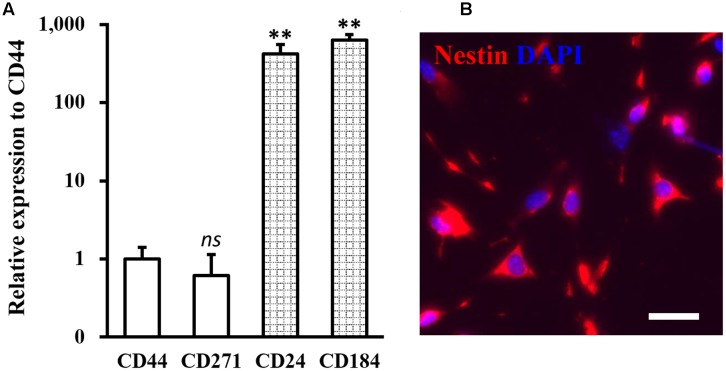
FIGURE 1.
Identity of isolated neural stem cells (NSCs). (A) Expressions of NSC specific negative markers CD44 and CD271, and positive markers CD24 and CD184 were analyzed in isolated NSCs. Data were presented as mean ± SD from at least three independent experiments. ∗∗p < 0.01, ns not significant, vs. CD44. (B) Immunofluorescence staining of NSC with nestin in red and DAPI in blue. Scale bar 100 μm.

