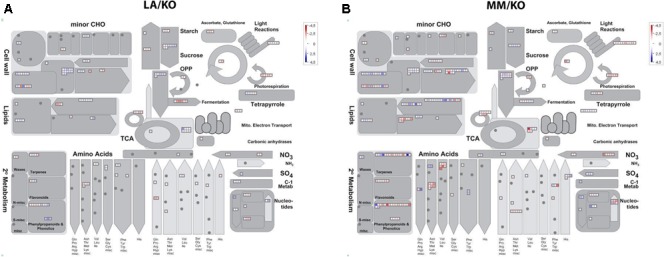
FIGURE 3.

Assignment of differentially expressed genes upon different temperatures in the roots of the grafting combination ‘Kommeet’ grafted onto LA 1777 (LA/KO) (A) and onto ‘Moneymaker’ (MM/KO) (B) to the functional category metabolism using MapMan. Log2-fold expression differences for individual genes are plotted into bins grouped according to their putative functional annotation. Squares within bins are colored red for an up-regulated and blue for a down-regulated gene with darker color reflecting a stronger differential expression.
