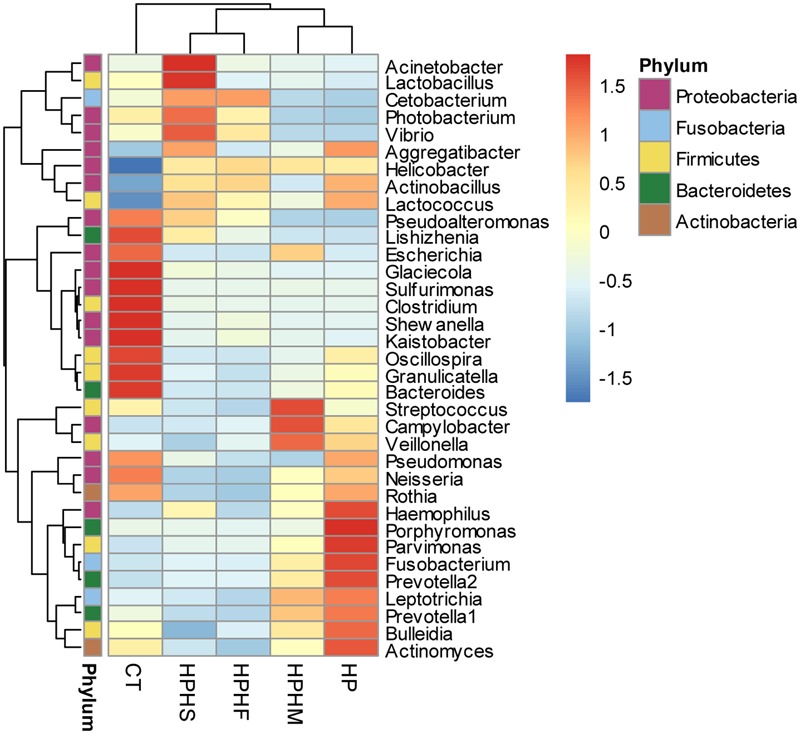
FIGURE 3.

Heatmap of the relative abundance distributions of the genera. Red: up-regulation, blue: down-regulation. HPHS: H. suis and H. pylori coinfection; HPHF: H. felis and H. pylori coinfection; HPHM: H. salomonis and H. pylori coinfection; HP: H. pylori monoinfection; CT: Helicobacter-negative.
