
FIGURE 3.
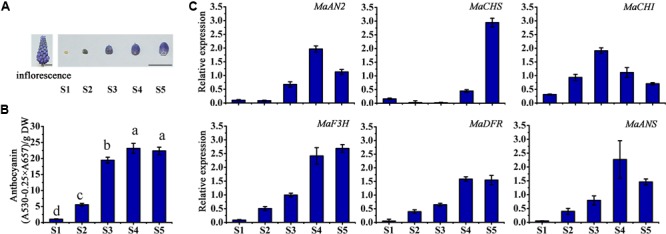
The anthocyanin content and expression profiles of anthocyanin regulatory and structural genes at different flower developmental stages in M. armeniacum. (A) The inflorescence and the petals of five flower developmental stages of M. armeniacum. Bars, 1 cm. (B) The total anthocyanin content of petals at the five flower developmental stages. DW: dry weight. Different lower case letters represent significant difference calculated using Least–Significant Difference (LSD) analysis at the level of P < 0.05. (C) The expression profiles of MaAN2, MaCHS, MaCHI, MaF3H, MaDFR, and MaANS in flowers during the five developmental stages (S1–S5) of M. armeniacum. MaActin was the reference gene to normalize the expression of these genes. Each column represents means ± SD from three independent experiments.