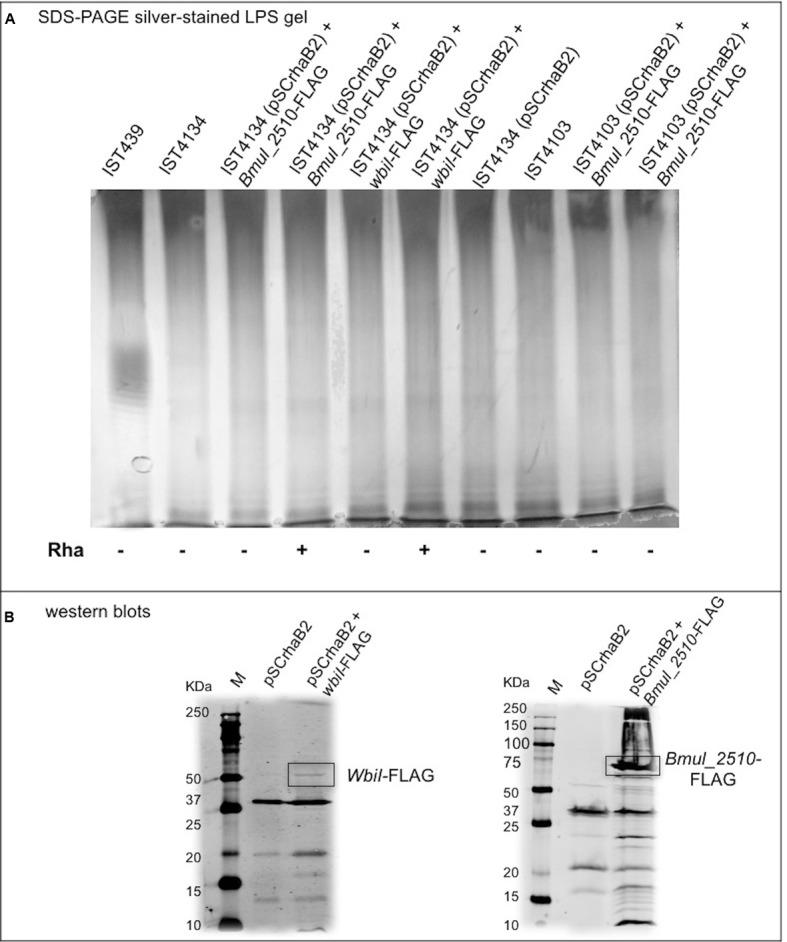
FIGURE 8.

Characterization of the OAg unit after cloning and introduction of B. cenocepacia IST439 wbiI and Bmul_2510 genes in all variants lacking OAg production to complement the corresponding mutated genotypes. (A) LPS electrophoretic profiles for IST439, IST4134, and IST4103 showing the presence/absence of OAg units, and OAg absence in all transconjugants selected; (+) denotes 1% (w/v) rhamnose and (–) denotes no rhamnose added to the medium. (B) Western blots showing bands at around 60 KDa (left) and 75 KDa (right), which indicate WbiI and Bmul_2510 polypeptides, respectively. Lanes shown (left to right): protein ladder (M), cloning vector pSCrhaB2, cloning vector + WbiI-FLAG or Bmul_2510-FLAG.
