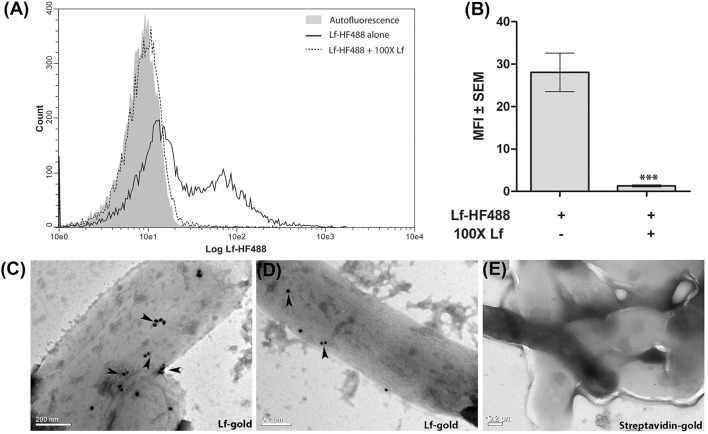
Figure 1.
Surface binding of Lf. (A,B) FACS analysis indicates specific binding of Lf-HF488 on the surface of M.tb H37Ra cells (A) Overlay histogram plot of one representative experiment indicating log fluorescence of Lf-HF488. (B) Bar graph depicting MFI ± SEM. (C–D) TEM images reveal the binding of Lf conjugated gold particles (indicated by arrow heads) and (E) Control cells treated with control Streptavidin gold particles, demonstrate no surface binding of gold particles. Scale bar 0.2 μM. Multiple fields were analyzed with each sample, representative images are shown.

