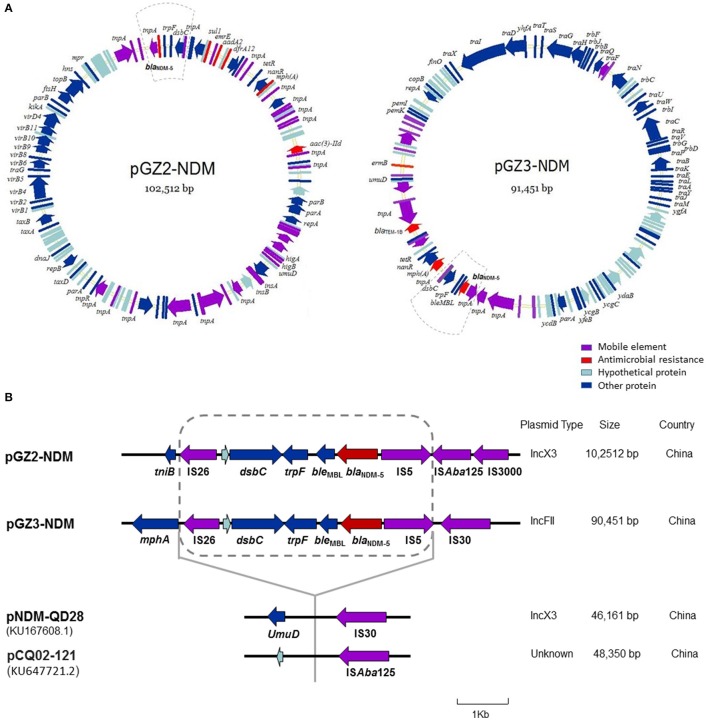
Figure 3.
Plasmid analysis of pGZ2-NDM and pGZ3-NDM. Structure map of pGZ2-NDM and pGZ3-NDM (A) and comparative analysis of the genetic contexts of blaNDM-5 in plasmids reported in this study and previously described (B). The gene name is shown next to the corresponding arrow or rod. Genetic regions with dashed lines in pGZ2-NDM and pGZ3-NDM are indicated as blaNDM-5 region. The genetic environment of blaNDM-5 (with dashed line) in pGZ2-NDM and pGZ3-NDM was similar as that previously described in pNDM-QD28 (GenBank accession KU167608.1) and pCQ02-121 (GenBank accession KU647721.2) with 100% query coverage and 99% identity. However, the regions containing blaNDM-5 were inserted into different genes and plasmid backbones.

