
FIGURE 2.
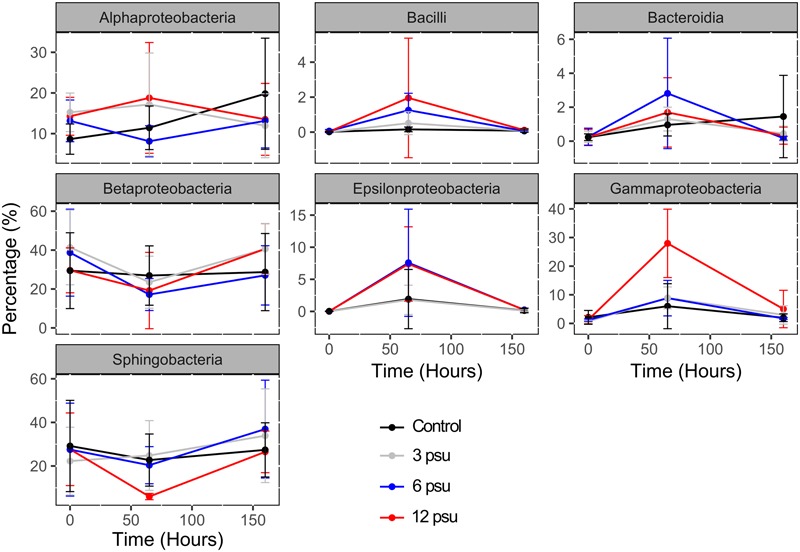
Changes in the relative abundance of sequences associated to the main bacterial phyla, families and genera over time and between salinity levels. Error bars indicate standard errors.
Official websites use .gov
A
.gov website belongs to an official
government organization in the United States.
Secure .gov websites use HTTPS
A lock (
) or https:// means you've safely
connected to the .gov website. Share sensitive
information only on official, secure websites.
Changes in the relative abundance of sequences associated to the main bacterial phyla, families and genera over time and between salinity levels. Error bars indicate standard errors.