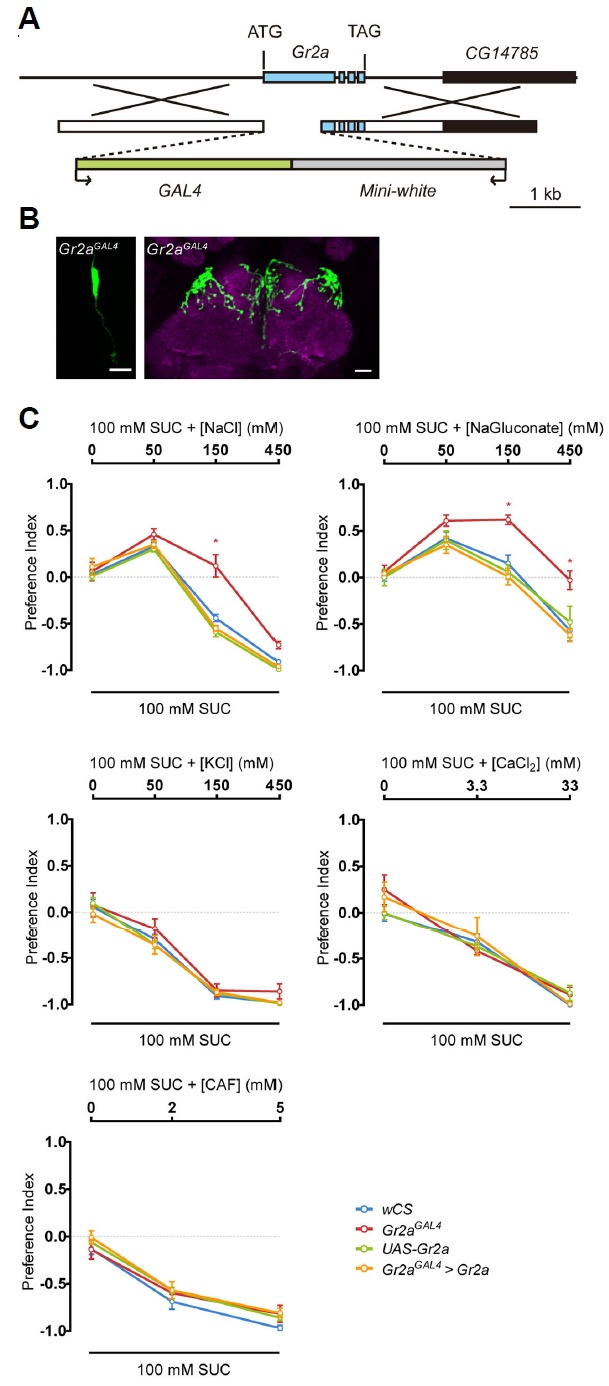
Fig. 4.

The Gr2a mutant (Gr2aGAL4) shows repression of feeding suppression specific to high concentration Na+.
(A) Schematics showing the mutant generation strategy for Gr2aGAL4. (B) Gr2aGAL4-driven GFP reporter expression. The LSO and axonal projections to the SEZ are the same regions marked in Fig. 1A and 1C, respectively. (C) Feeding preference in response to the indicated salts and caffeine (CAF) at various concentrations. Two-way ANOVA and the Bonferroni post hoc test were used for analysis of significance. Asterisks signify statistical significance (*p < 0.05). For each data point, 6 < n < 10.
