
Fig. 1.
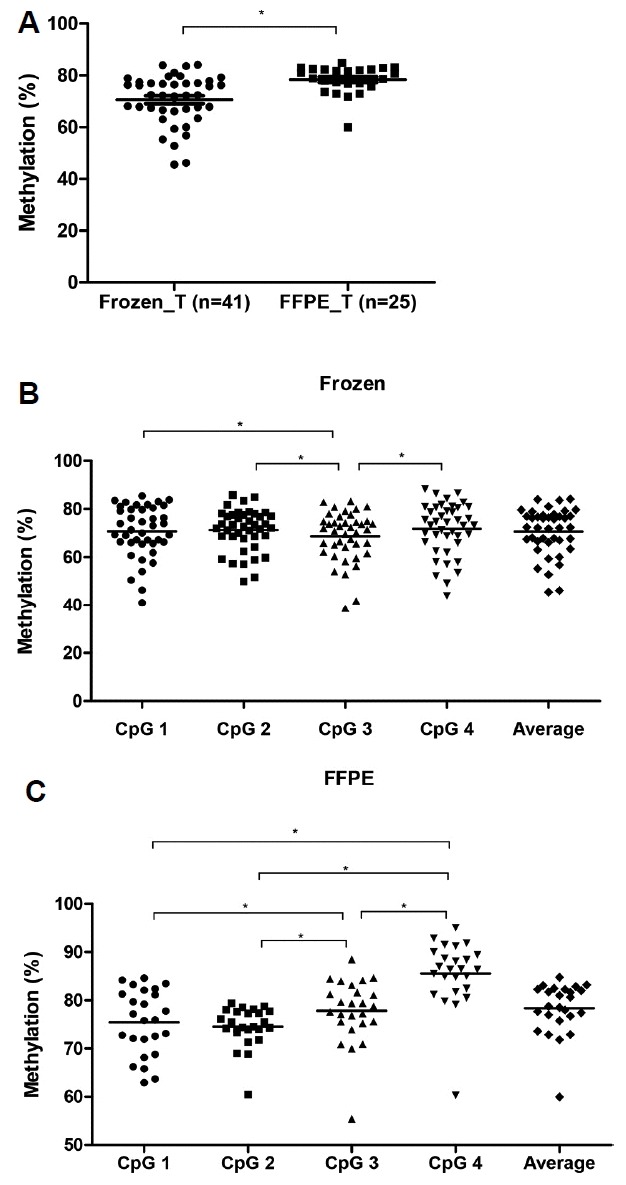
LINE-1 methylation status according to sample types.
(A) The average LINE-1 methylation level (%) was significantly different between the frozen tumor tissues and FFPE GC tissues (*p < 0.001, unpaired t test). (B) In 41 frozen GC tissues, LINE-1 methylation level (%) was significantly lower at CpG3 than at CpG1, CpG2 and CpG4 (p = 0.031, p < 0.001, p < 0.001, respectively). (C) In 25 FFPE GC tissues, CpG3 was significantly hypermethylated compared to CpG1 (p = 0.022) or CpG2 (p < 0.001). CpG4 showed the maximum hypermethylation compared to other three sites (p < 0.001, p < 0.001, p < 0.001, respectively). *p < 0.05, paired t test.