Fig. 1.

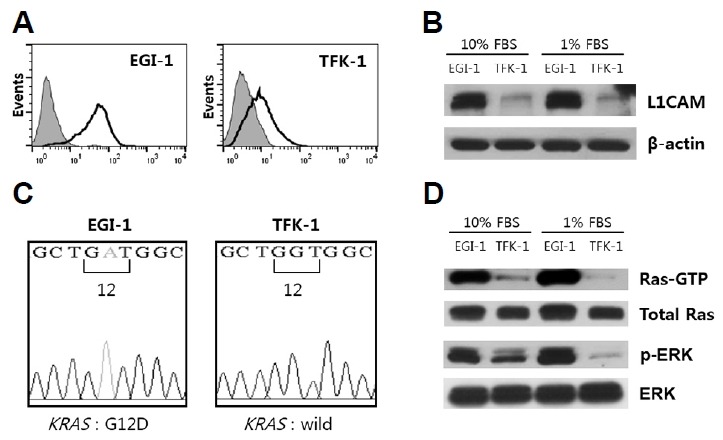
Analyses of L1CAM expression and KRAS mutation in EGI-1 and TFK-1 cells.
(A) Cell surface expression of L1CAM was confirmed by flow cytometry with an anti-L1CAM mAb (black line) vs. a negative control (grey). (B) Western blot analyses of L1CAM expression in cells cultured in medium supplemented with 10% FBS vs. 1% FBS; β-actin was used as a loading control. (C) Electropherogram showing the DNA sequence of exon 2 of the KRAS gene at codon 12. The EGI-1 cell line carries the G12D mutation while the TFK-1 cell line contains the wild type KRAS gene. (D) Western blot analyses of RAS and ERK activation in cells cultured in media supplemented with either 10% or 1% FBS. Results are representative of three independent experiments.
