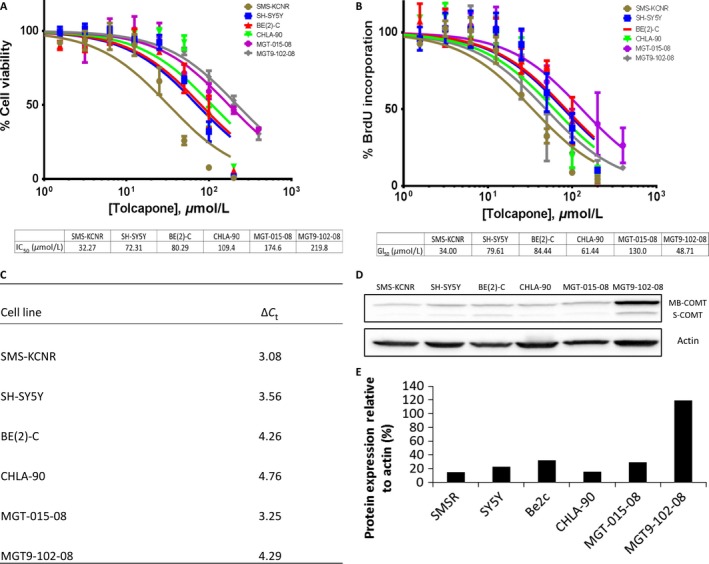
Figure 2.

Tolcapone exhibits cytotoxicity as a single agent in four NB cell lines and two primary tumors. (A) IC50 values were calculated 48 h postintroduction of Tolcapone drug treatment using Calcein AM fluorescent assays. (B) GI50 values were calculated 48 h postinduction of Tolcapone drug treatment using BrdU assays. (C) RT‐qPCR was run on lysates from all cell lines used to determine basal mRNA levels of COMT. ∆CT represents the change in cycle threshold of COMT compared to β‐Actin. (D) Western blot was run on lysates from all cells to determine basal protein levels of MB‐COMT and S‐COMT. (E) Bands were normalized to β‐Actin control and quantified as a percent compared to β‐Actin expression.
