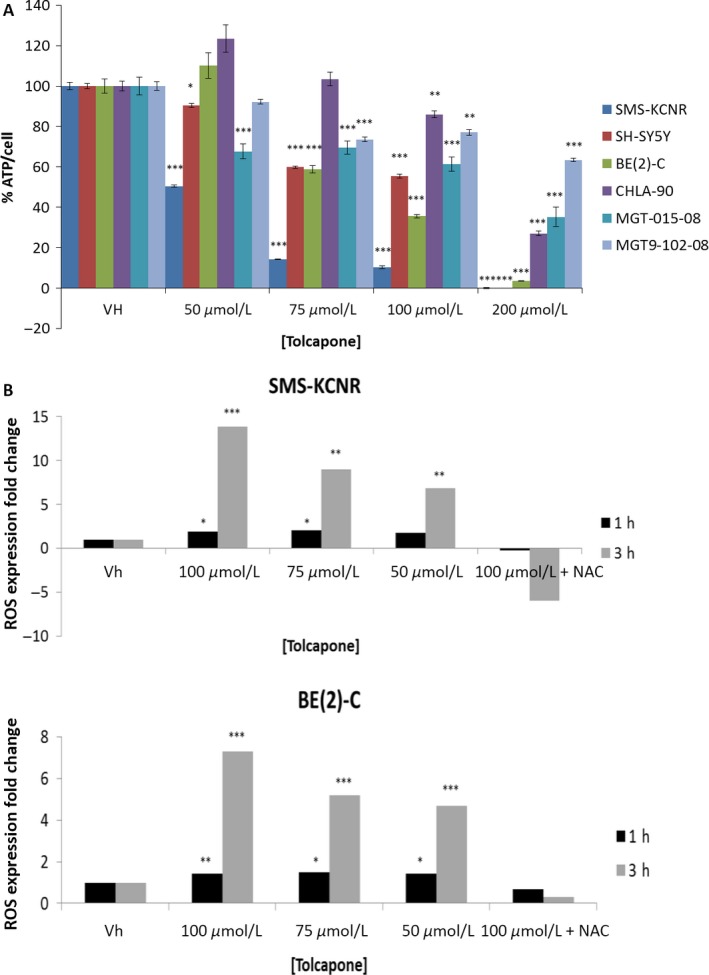
Figure 5.

Tolcapone treatment corresponds to a dose‐dependent decrease in cellular metabolic activity and increase in reactive oxygen species (ROS) in NB cell lines. (A) Cells were treated with Tolcapone (0–200 μmol/L) for 48 h. Cell Titer GLO was used to measure total cellular ATP and CyQuant was used to measure total cellular DNA (n = 3, graph is representative of one replicate). Values are mean ± SD. (B) Cells were stained with 20 μmol/L DCFDA to measure ROS for 45 min and then treated with varying concentrations of Tolcapone (0–100 μmol/L) with or without NAC for either 1 or 3 h (n = 3, graph is representative of one replicate). Values are mean ± SD (*P < 0.05, ** P < 0.01, *** P < 0.001).
