
Figure 2.
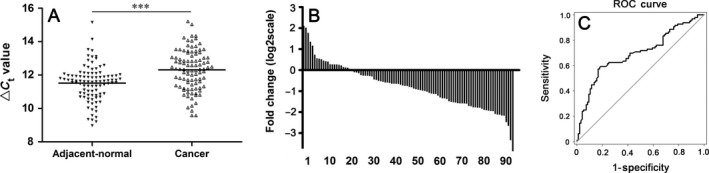
Hsa_circ_0014717 expression levels in gastric cancer tissues. (A) Hsa_circ_0014717 levels in 96 gastric cancer tissues and their matched adjacent nontumorous tissues were detected uisng qRT‐PCR method. Larger ΔC t value indicates lower expression. ***P < 0.001. (B) Hsa_circ_0014717 levels were significantly downregulated in 77.2% (74/96) of gastric cancer tissues. (C) ROC curve was built for differentiating gastric cancer tissues from controls. The area under the curve was up to 0.696. ROC, Receiver operating characteristic.