
Figure 4.
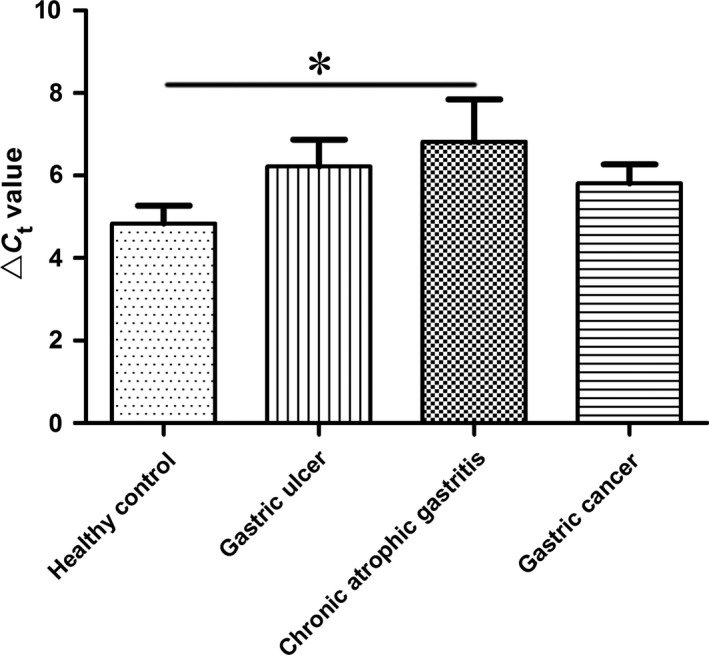
Hsa_circ_0014717 levels in gastric juices. Hsa_circ_0014717 levels in gastric juices from various stages of gastric carcinogenesis including healthy controls (n = 38), patients with gastric ulcers (n = 30), chronic atrophic gastritis (n = 15) and gastric cancer (n = 39) were detected by qRT‐PCR. Larger ΔC t value indicates lower expression.*P < 0.05.